Unprecedented mortality jump in 18-64 age group, NOT due to COVID-19

OP
haidut

haidut

Member
Forum Supporter
Joined
Mar 18, 2013
Messages
19,799
Location
USA / Europe
Walmart had a similar plan.
There is special term for it. It is called "dead peasants" insurance. Michael Moore discusses it extensively in his movie "Sicko". I have no idea why a company is legally allowed to take an insurance policy on an employee's life. To me, that is a blatant moral hazard - i.e. since the company controls the working conditions of said employee, it can easily devise various schemes to ruin their health while at work.
 
Last edited:

Matestube

Member
Joined
Dec 28, 2021
Messages
912
Location
Dubai
I've seen people research this and still found the covid vaccines still outpace all other vaccines in deaths in vaers.

Well, yes, because a death from mercury poisoning happening 6 years after a measles shot that contained mercury will never be counted as a death from a vaccine shot.
So these people searching will miss out a lot of deaths.
 

blob69

Member
Joined
Nov 6, 2015
Messages
362
This was my first thought too, but Yeadon didn't seem to believe that this is plausible. The video in which Wodarg explains why he thinks that it is trials within trials has been posted here. He basically shows patterns in the data.

..........

Edit to add: I've now seen that there is a separate thread about it,

I replied to the thread about vaccine batches, copying my reply here too...

This is very interesting, I came to the same conclusion myself after seeing some people in my country being harmed badly by vaccines (usually J&J or Astrazeneca) while others (mostly those who took Pfizer) didn't have ANY reaction, even the usual expected ones like a sore arm, low fever etc. So in my country it seems Pfizer is a saline or some other pretty harmless stuff and I'm SO grateful that my elderly mother got this one - three times already, each time without the slightest reaction.

Is it possible that Pfizer, the criminal entity that it is, simply sent some saline around because they couldn't provide for such massive demand? Or perhaps to come out as the winner in the game with the least side-effects while Astrazeneca and others are vilified to oblivion?
 

David PS

Member
Joined
Jan 5, 2016
Messages
14,675
Location
Dark side of the moon
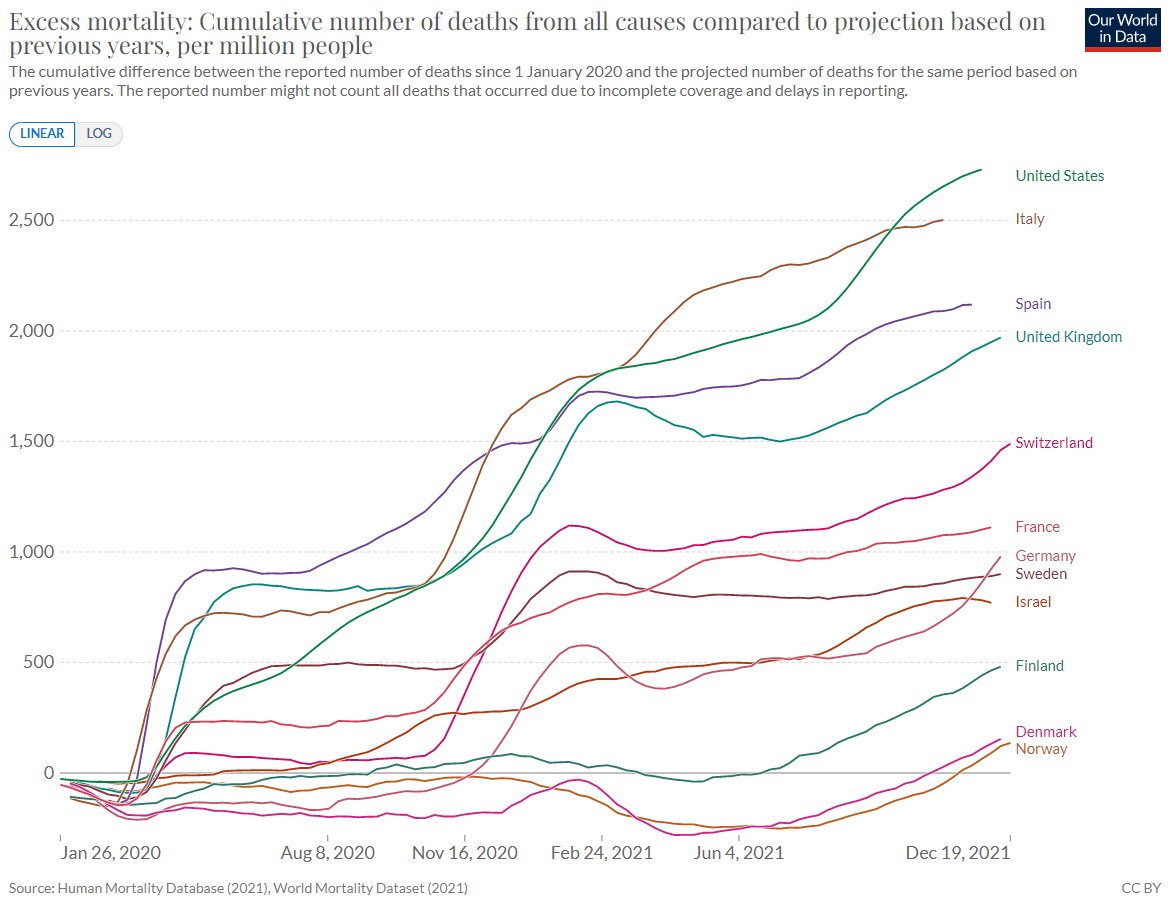
Excess mortality plots tell the story. They just keep going up. USA - We are #1.
FIRvxvfXMAcN6uT
 

bk_

Member
Joined
Apr 6, 2018
Messages
356
Excess mortality plots tell the story. They just keep going up. USA - We are #1.
FIRvxvfXMAcN6uT
This is based on nominal counts. Turn it into a rate, e.g. per 100k, and a more disturbing picture appears. Italy, Spain, and the UK would be far surpass the US. I wonder if this is correlated to the COVID prophylactic delivered via injection?
 
OP
haidut

haidut

Member
Forum Supporter
Joined
Mar 18, 2013
Messages
19,799
Location
USA / Europe
I wonder if this is correlated to the COVID prophylactic delivered via injection?

What else could it be? It can't be due to lockdowns as most countries did not really have much in terms of lockdowns in 2021 (except Australia and New Zealand). It is not opioids and alcohol as the causes of death are all over the places while the ones due opioid/alcohol (outside of simple overdose that directly kills them) are clustered in a small subset (e.g. liver failure, kidney failure, seizures, etc). It is not the excess violence as the deaths from that, while strikingly higher, do not even come near the numbers the insurance company is quoting. And it is not due to people delaying going to the doctor out of fear of the virus and thus having their condition exacerbate and become lethal, since historically when people stop going to the doctor the death rate plummets. And, as a specific example/corroboration, when everybody truly stopped going to the doctor last year (2020) deaths from CVD, stroke, etc literally disappeared.

So, while some obscure reason can always be concocted and presented by worthless scum like Fauci as the holy truth, the evidence relentlessly points to the vaccines.
 
Last edited:

Kram

Member
Joined
May 8, 2017
Messages
384
Below are 13 different ways using VAERS and real world data which suggest the vaccines have killed 150k+ in the US.
Also in detail in this document https://www.skirsch.com/covid/Deaths.pdf


Definitions​

URF = VAERS underreporting factor. This is the ratio (# events that actually happen/# events reported in VAERS). So if VAERS has 10 events and the URF=41, then it means 410 events are likely to have happened, but only 10 events were reported to VAERS.

Executive summary​

This is the data we use in our computation:

  1. Known rate of anaphylaxis from JAMA paper published on March 8, 2021: 2.47 per 10,000 doses (A)
  2. Number of people who had at least one dose before April 1: 97.5M (see below) (B)
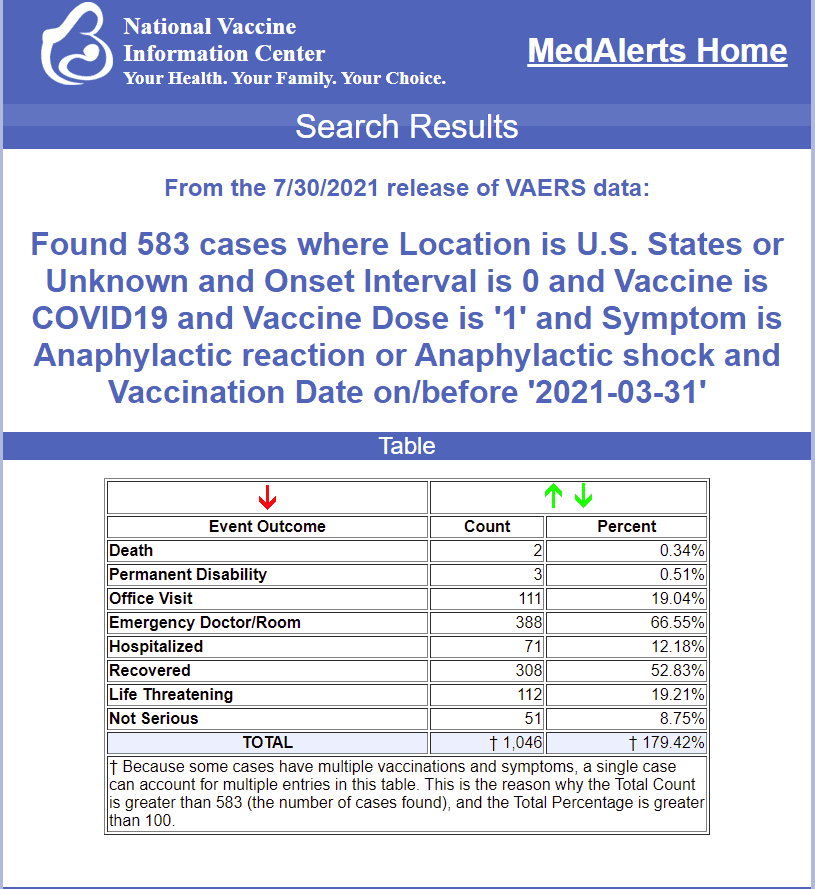
  3. Number of anaphylaxis cases on dose 1 in VAERS before April 1: (see below) (C)
  4. Today’s number of US deaths in VAERS: 9623 (Jan 5, 2021) (D)
  5. Largest number of deaths reported to VAERS in prior years: 223 (in 1994) (E). You can see this on the same red box page on OpenVAERS by mousing over each year.
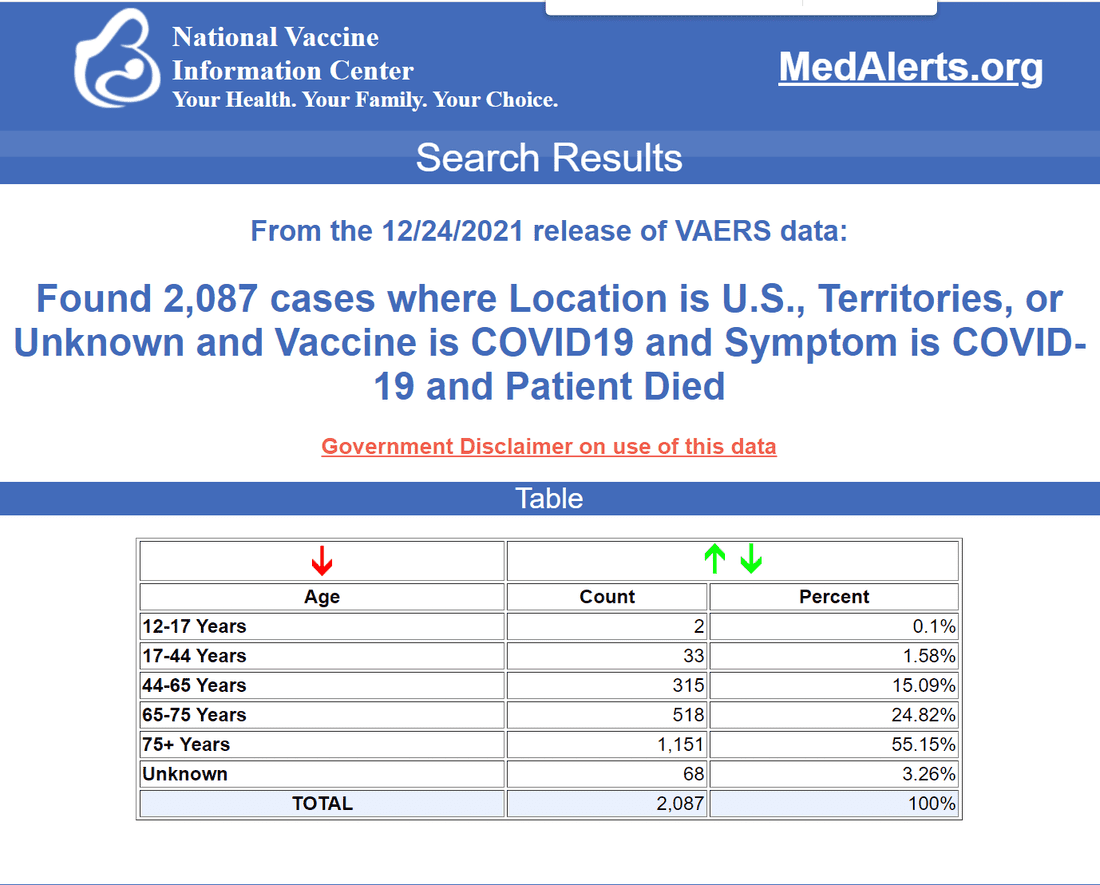
  6. Number of deaths in VAERS in the US that mention COVID19 as a symptom: 2087 (F)
To compute the underreporting factor (URF), we solve the equation A=(C*URF)/B. This just says that “the rate in the clinical trial’ = “the rate in VAERS” (adjusted by the URF.

This means URF=(A*B)/C = 2.47/10000 * 97500000/583 = 41.3

To compute the excess deaths, we use deaths = (D-2*E)*URF = (9623-2*223)*41.3 = 379,010. The reason we took out 2*E is that we are looking for excess deaths and since people are seen twice, it’s conservative to double the total number of deaths in a previous year.

While it is possible that some of these 379K excess deaths could have been caused by COVID, doctors are very unlikely to report a COVID death in VAERS since everyone agrees that the vaccines do not cause COVID. Doctors don’t want to pollute the VAERS database with unrelated events and most doctors don’t want to report to VAERS because they don’t want to make the vaccines look dangerous: doing so would make them look bad for recommending the vaccine to their patients.

But to be conservative, anytime COVID19 is mentioned in the symptom field, let’s assume that the patient really died from COVID rather than “with” COVID19. This removes F*URF = 2,087 deaths * 41.3 = 86,193.

We are left with an estimated 292,817 deaths caused by the vaccine using VAERS.

Using 12 other methods, we estimate a death toll of 150,000 or more.

Therefore, 150,000 is a high confidence estimate whereas 300,000 is likely closer to the actual number.

About VAERS​

The Vaccine Adverse Event Reporting System (VAERS) is the official system used by the US government to track adverse events from all vaccines. Many people are familiar with the V-Safe program since they ask you to enroll when you get the vaccine. If you report an adverse event in V-Safe, you’ll get a call from HHS and they’ll tell you to report that adverse event to VAERS. Many people don’t do that, or don’t know about VAERS or V-Safe, so VAERS is always underreported.

According to a paper analyzing this published in 2015 in a peer reviewed journal, the underreporting is by a factor from 9.52 to 95.5 times. See Why won't the CDC or FDA reveal the VAERS URF? for more details on this.

Understanding the VAERS URF​

Computing the underreporting factor (URF) is thus crucial to understanding the actual number of events that are happening.

Using methodology approved by the CDC and data from VAERS and a paper published in one of the world’s top medical journals, we can compute an estimate of the underreporting factor (URF) of 41 for the most serious/obvious events reported to VAERS. I’ll step through the process of how I computed the value of 41 in detail later in this article.

The URF of 41 is a minimum URF; the URF for “less obvious” events (including death) is always larger than this value. So for example, if you had menstrual problems, peripheral neuropathy, or your cancer got worse after the jab, the URF for that event might be 100 or more.

For example, President Biden had peripheral neuropathy after his booster shot and that event was never reported to VAERS because his expert physicians didn’t realize that it is a very common side-effect of the vaccine.

Therefore, 41 is a “best case” number because it is based on anaphylaxis rates shortly after vaccination which are required by law to be 100% reported to the VAERS system. It doesn’t get any more “clear cut” than that.

What this means in practice is that if you see a number in VAERS such as 9,623 reported deaths, you have to multiply that number by the estimated URF (41 in our case) to get a lower-bound estimate of the actual number of deaths, in this case 394,543. However, not all those deaths were caused by the vaccine which I’ll explain shortly. But that’s how the URF works.

In general, it’s very simple:

Actual # of events = (# from VAERS) * URF

How CDC scientist Dr. John Su deliberately misleads everyone​

The top expert on VAERS at the CDC is Dr. John Su. Dr. Su deliberately misleads the outside committees of the FDA and CDC by never talking about the URF at all. This allows him to report rates of adverse events that are 41 times or more lower than the true rates.

I’ve written about Dr. Su extensively:

  1. It’s time for John Su to go
  2. Dr. John Su isn't answering me. Can you try?
  3. John Su interview request
Furthermore, despite repeated requests, the FDA and CDC refuse to compute the URF which means it is impossible for anyone to compute an accurate risk-benefit analysis using the government calculated URF. They know exactly what is going on. It is deliberate fraud. This is why they don’t want to talk to me and will never debate me. An open debate would be their worst nightmare.

Because there is no URF computation from the CDC, experts like Dr. Toby Rogers use a value of 41 for the URF in order to calculate the risk-benefit for injecting kids 5 to 11. His conclusion: “For every one child saved by the shot, another 117 would be killed by the shot.” In other words, we kill 117 for every child we might save.

In short, by ignoring the URF, the CDC is deliberately deceiving the public; it allows the CDC to report numbers which are significantly lower than they really are, making the vaccines appear to be much safer than they really are.

So, for example, the rates of myocarditis they report are, in actuality, likely to be 50 times or more higher than they tell you. This explains how we can see myocarditis rates as high as 1 case for every 95 boys.

Why the huge spike in adverse events including death? Is it just overreporting?​

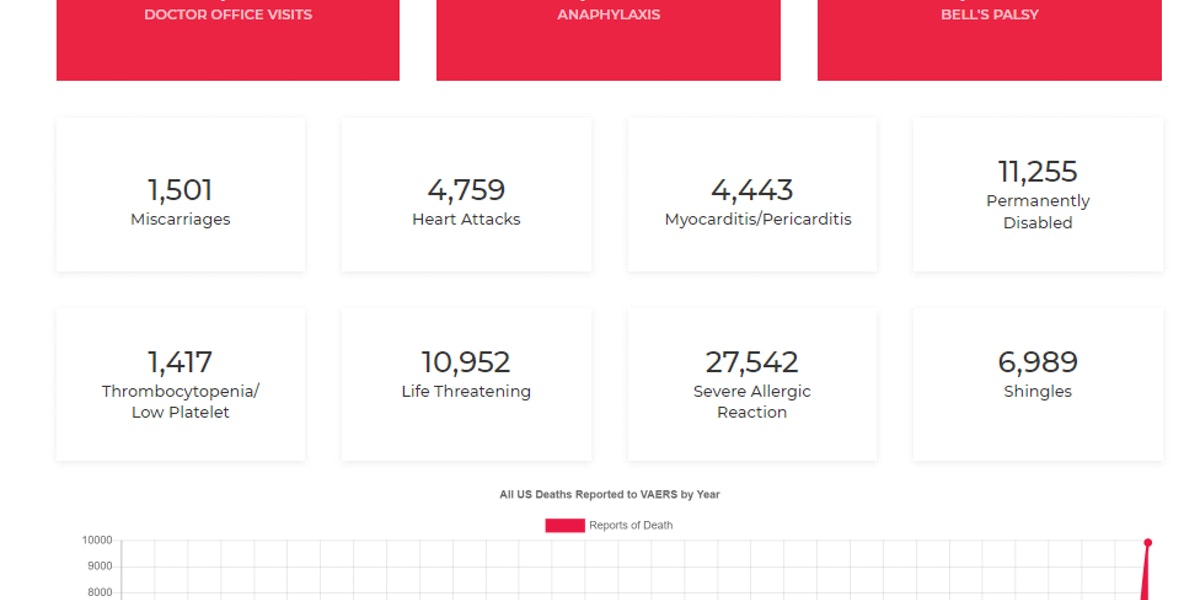
Now let’s look at the numbers from Openvars.com which is a consumer-friendly website for looking at the VAERS data. The red-box summary page for domestic events (slide the slider at the top to the right) shows 9,623 deaths of Americans:


Also, note the deaths graph above. It’s a flatline for 30 years, then spikes up this year. In short, either:

  1. Everyone suddenly decided to start using VAERS this year and these are all background deaths (this is known as the “overreporting hypothesis” OR
  2. The vaccines are super dangerous OR
  3. A combination of 1 and 2.
The final bottom graph is a clue. The death rate peaks one day after vaccination. This is a hint of causality since if it were just likelihood to report, you’d see it exponentially decline from day 0.

If the vaccine were harmless, that fatality graph would be flat. It isn’t.

We also see dose dependency: the symptom profile after dose 1 don’t look like the results after dose 2. This is very difficult (some would say impossible) to explain if the vaccine had no effect.

For an in-depth discussion of why virtually all the deaths are reason #2, see Estimating the number of COVID vaccine deaths in America.

But the short story on why there is no overreporting is that:

  1. People’s behavior is really hard to change (even with massive amounts of advertising like they did in 2009 which didn’t change the numbers at all),
  2. There has been no campaign to try to encourage reporting to VAERS (in fact, we see exactly the opposite)
  3. Most doctors don’t know about VAERS or report to VAERS (in my interview with Dr. Kreitzman, for example, he said he knew hundreds of doctors and none of them reported to VAERS).
  4. Most doctors truly believe that the vaccines work. Because they don’t want to make the vaccines look dangerous (which would then tarnish their reputation), they are simply going to be less likely to report to VAERS. I can’t tell you how many times I hear the story where a healthcare workers asks, “Did you report it to VAERS?” and the answer is “Of course not.”
  5. We can look at events that are not related to the vaccines at all like the reporting rates for hepatitis, metal poisoning, and otitis media. These are all nearly the same as previous years (metal poisoning is actually down this year by a factor of 5). So if it was overreporting, we’d expect to see these unrelated symptoms to be overreported as well.
  6. We couldn’t find any evidence of anyone reporting at a higher rate than before. In fact, we find evidence of the opposite, like a neurologist who needed to report 2,000 cases this year (she’s never needed to report to VAERS in her 11 year in private practice), yet this year she’s only reported 2 because it was too time consuming.
  7. We have data that supports the argument that VAERS is actually significantly underreported this year. For example, a doctor with 29 years of experience never had to make a VAERS report before now has 25 cases to report (in around 1000 patients). This is a 725-fold increase in adverse events compared to past years. Yet VAERS this year reflects only around a 30-fold increase. You are welcome to do you own survey of doctors to validate this. None of my detractors ever do this, including the FDA.
They never show us any data to back up their claims of “oh, this is just because people are reporting more.” And none of the so-called fact checkers ever ask them for proof of that. So the overreporting hypothesis is simply a hand-waving argument with no evidence to back it up.

The bottom line is this: a conservative estimate of the number of deaths caused by the vaccine is:

(9623-2*223)*41.3 = 379,010

To be more conservative, let’s assume that anyone who had COVID and died, died from COVID. So we remove 2,087 deaths * 41.3 = 86,193 and are left with

292,817 American deaths caused by the vaccine

In short, the US government is responsible for the killing of hundreds of thousand of Americans and not a single member of Congress is calling for a stop to the vaccines. That’s really stunning.

The argument that correlation isn’t causality​

Scientists love to argue that correlation isn’t causality.

But we can show all of the Bradford-Hill causality criteria are satisfied.

But it’s simpler just to point out that the excess deaths are there and they are huge. If it wasn’t the vaccine that caused these people to die, then what did?

Nobody can answer that question.

How to calculate the URF​

We showed how to calculate the URF in the summary at the start of this article.

How to validate the results​

We validated the calculations by estimating the excess deaths 12 different ways that didn’t involve using VAERS:

  1. Excess CFR analysis
  2. Excess death analysis
  3. Small island study
  4. Norway data
  5. Poll #1
  6. Poll #2
  7. Doctor survey
  8. Pilot data (British Airways)
  9. Scotland data
  10. Columbia university excess death analysis using public datasets from US and Europe
  11. Indiana insurance company excess death rate 40% increase in 18 - 64 year-olds
  12. Pfizer 6 month trial all-cause mortality data (21 vs. 17)
Each of these methods found an excess death rate of 150,000 or more. The methods are detailed in this document: https://www.skirsch.com/covid/Deaths.pdf

This is why when I talk about the deaths caused by the vaccine, I almost always use the 150,000 figure since it is the most conservative, but my closest estimate to the true number is 300,000 at this time.

The statistics used in the executive summary​

Here is the backup for three of the numbers used in the executive summary (B, C, and F). The other numbers are directly available at the website referenced in the summary.

B:


C:


F:


Why are the authorities so afraid to challenge my methods?​

No recognized expert on the pro-vaccine side will debate me or any of my statistics and VAERS experts on this. Nobody.

Eric Topol blocked me. The FDA and CDC don’t answer. Even when a former NY Times writer asked, they refused to discuss it with him (so it’s nothing personal). I couldn’t even get a debate with ZdoggMD or Your local epidemiologist. None of these people wants to appear on camera to challenge me on this.

UPenn Professor Jeffrey Morris said my number was wrong, but he admitted he was clueless as to what the number was. Only that it couldn’t be that high. Really? How can he know that if he can’t calculate the number and is clueless himself on how to estimate it?

I point out that I used the methodology of the CDC, I used the death count from the government database, and I used anaphylaxis rates from a study in JAMA. So if I made a mistake, where is it? No answer.

I’ve invited Professor Morris to a live video recorded discussion for everyone to see, and he refuses every time. I’m just a lowly engineer with a couple of degrees from MIT in electrical engineering and computer science. He’s a professor and Director of the Division of Biostatistics at UPenn. But he’s afraid of me. Here’s more on Professor Morris.

Gordon Cormack, a computer science professor at University of Waterloo, loves to argue that he disagrees with my methodology. Hey, I’m just going by the CDC’s methodology and using the most accurate numbers I can find. I’m fine with being wrong if he would just show us all the correct answer. But he never does. Here’s a typical response that I send him:

Why don't you show me the proper way to estimate the number killed by the vaccine, and then show me 12 independent ways that validate you got it right? What is the number YOU calculated? And if I got it wrong, why not claim the $1M prize I offered on correcting Mathew Crawford’s analysis?
Gordon responds it’s impossible to estimate the number killed. OK, then how can he be so sure that all these calculations by different people using different methods that come to the same answer are all wrong? Well, he can’t. And when I offered to debate him on camera with my standard rules (which are completely fair to both sides), he declined and didn’t propose modifications to the rules. He clearly is not interested in a live debate.
 

dbh25

Member
Joined
Jul 29, 2016
Messages
653

J.R.K

Member
Joined
Aug 4, 2020
Messages
1,837
I was wondering if the insurance industry would be provided an out.
I also wondered if part of or all of that industry are rolled into the megacorp with Vanguard and Blackrock.
 

yerrag

Member
Joined
Mar 29, 2016
Messages
10,883
Location
Manila
Excess mortality plots tell the story. They just keep going up. USA - We are #1.
FIRvxvfXMAcN6uT

what do the numbers on the y-axis mean? per million population?
 

David PS

Member
Joined
Jan 5, 2016
Messages
14,675
Location
Dark side of the moon
what do the numbers on the y-axis mean? per million population?
The numbers are normalized to account for the fact that the countries have different size populations.
 
EMF Mitigation - Flush Niacin - Big 5 Minerals

Similar threads

Back
Top Bottom