mayku-T-meelo
Member
- Joined
- Sep 24, 2016
- Messages
- 188
Initial report of decreased SARS-CoV-2 viral load after inoculation with the BNT162b2 vaccine - Nature Medicine
Breakthrough infections of SARS-CoV-2 occurring 12 or more days after the first dose of the BNT162b2 mRNA vaccine were associated with lower viral loads than those found in unvaccinated individuals, suggesting that the vaccine might reduce infectiousness.
 www.nature.com
So the study found that the viral load after taking the Pfizer vaccine is apparently substantially reduced, that claim or similar ones will be definitely be pushed and used to show the efficacy and purpose for vaccinating people.
What they say is:
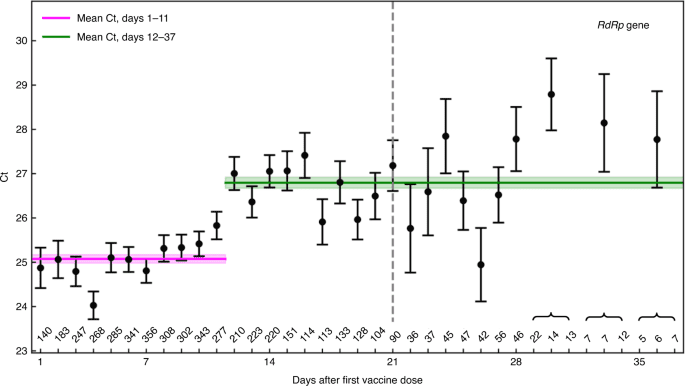
When we calculated the mean Ct for post-vaccination infections identified on each day after vaccination, we found that the Ct values of positive samples collected 12–37 d after vaccination with the first dose (a second dose having been given on day 21 for all samples taken after day 21) were higher than the Ct values of positive samples taken during the first 11 d after vaccination for the RdRp gene (Fig. 1) and for the genes N and E (Extended Data Fig. 2) (P < 10−19 for the three genes, Mann–Whitney U-test). Differences in mean Ct calculated for these two time periods ranged from 1.7 ± 0.2 for RdRp to 1.6 ± 0.2 for gene E and 1.4 ± 0.2 for gene N.
[...]
We next compared the Ct values of these post-vaccination infections with Ct values of positive tests of unvaccinated patients.
What mean of Ct values are they even measuring here, how do they come up with those values? From the perspective on senselessness of PCR tests I grasped that those values of tests were pre-set by the manufacturer of the test. And that the "hot potato" of the story was that the too high of a value (that multiplies or potentiates the whatever viral load there is) is then producing the abundant false positives.
I know some of you are far better informed than I am. Does anyone understands this more in depth?