mayku-T-meelo
Member
- Joined
- Sep 24, 2016
- Messages
- 188
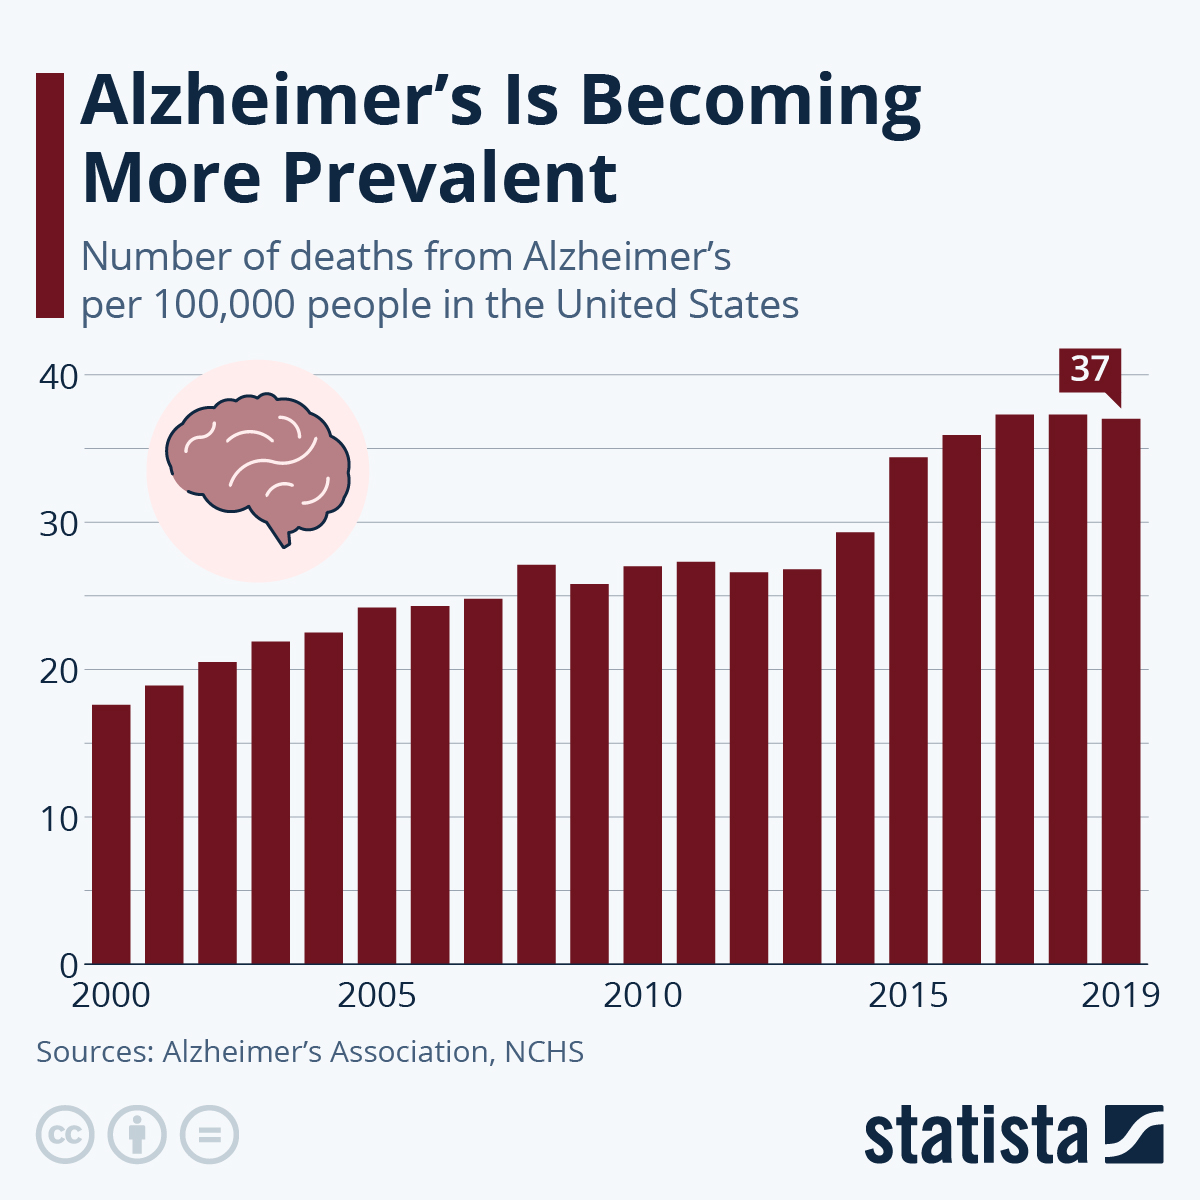
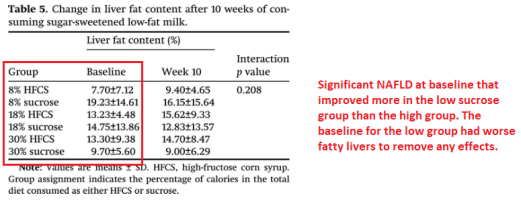
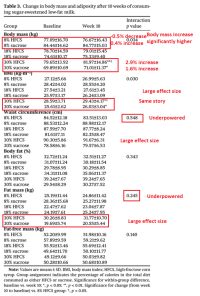
there was a study in humans that showed more than 4 servings of fruit a day increased fat mass, insulin resistance, and liver steatosis
Can you please link it? I can't find it by searching with keywords.