OP
Tristan Loscha
Joined
Dec 18, 2018
Messages
2,206
Firstly i never directly drink water only whats found in OJ, milk, coffee or foods. Secondly I dont urinate that often actually and its never clear like the 'healthy' people. Thirdly, as before, in the context of the average diet, any nutrient can be proven to he 'harmfull' but its not really proof at all. In a nutrient dense diet, one doesnt need to use NaCl sparingly. Thats context and its the RP way.
Im not recommending the average sheeple increase its intake or sugar or any other nutrient because basically they are FUBAR.


..Yet it seems that for Sodium,it isnt a relative effect,like the observed balance-like relation between Sodium and Potassium.
It is an absolute effect,and one cant discern if one is salt sensitive or salt resistive,
or has metabolic milieu that encourages salt-loading.In a "nutrient dense diet",if these findings hold true,based on metabolic make-up,you do have to moderate NaCl intake,because you consume otherwise supraphysiologic amount of this mineral,
and it has messenger effect and toxicity effect.Ask yourself the question,why you would hesitate to consume 10-to-20-fold
of zinc,iron or Potassium-salts.After all,you can,buy it from ebay,and then just load up your dispenser Bro!
 
OP
Tristan Loscha
Joined
Dec 18, 2018
Messages
2,206
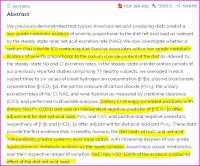
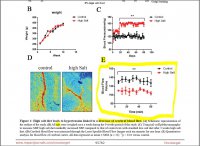
..A poster presentation in regards to delay of Puberty in Rats fed different levels of Salt in Food and Drink.
Salt to taste doesnt seem to work in rodents,they consume more Salt when it is possible,
and activating their stress axis and delay their onset of puberty by switching on some kind of crazy starvation-recognizing element..But maybe rodents know something we dont?


https://www.endocrine-abstracts.org/ea/0037/eposters/ea0037ep114_eposter.pdf


https://www.researchgate.net/profil...rmissive-Role-in-the-Induction-of-Puberty.pdf

Worth a look.
 
Last edited:

Dino D

Member
Joined
Nov 14, 2017
Messages
365
All those studies aside... ot should be easy to tell whats better, two weaks high salt (5+ gram a day) and two low salt 1.5g or lower) and report it back...
Low salt gives me low blood presure, low pump, lot of peing, darnduft
High salt bloats me, i get sluggish, more tinnitus...
With pottasium i dont know, i gues i dont notice anything with sups, and i dont trully eat a lot of veggies or fruit

However i belive many have tried low and high salt here and by now it should be known what works, it trully does and its very anoying that littelary every backed up ,,peaty claim" has the opposite claims with good proves... i ranted about this before but still, how does this forum, that is full of petty members with lot of knowledge manage to not get one thing, one advice clear and straight...
 

LLight

Member
Joined
May 30, 2018
Messages
1,411
Don't you think a lack of osmolytes and hyperinsulinemia (which could impair proper sodium excretion) could be the reasons of people sensitivity to salt?

Organic osmolytes as compatible, metabolic and counteracting cytoprotectants in high osmolarity and other stresses

So, salt and TH17 are associated, and TH17 seems to be involved in autoimmune diseases but it's not really clear to me if salt is really the final culprit.

Indeed, the NFAT5 transcription factor seems to be implicated in the regulation of TH17:
Context-dependent regulation of Th17-associated genes and IFNγ expression by the transcription factor NFAT5. - PubMed - NCBI
"NFAT5-deficient CD4 T cells activated in vivo by anti-CD3 antibody exhibited a different activation profile and were skewed towards enhanced interferon γ (IFNγ) and IL-17 expression and attenuated Treg responses."

If I'm not mistaken, salt should upregulate NFAT5, which itself should increase osmolytes uptake. See e.g. NFAT5 in cellular adaptation to hypertonic stress – regulations and functional significance

Moreover, osmolytes (at least betaine) could have anti-inflammatory properties:
Betaine suppresses proinflammatory signaling during aging: the involvement of nuclear factor-kappaB via nuclear factor-inducing kinase/IkappaB kinase... - PubMed - NCBI
Identification of betaine as an osmolyte in rat liver macrophages (Kupffer cells). - PubMed - NCBI ("Addition of betaine (1 mmol/L) to hyperosmotically exposed Kupffer cells abolished the strong induction of cyclooxygenase 2 and the increase of prostaglandin E2 formation.")
 
OP
Tristan Loscha
Joined
Dec 18, 2018
Messages
2,206
Time to rethink salt | Jens Titze | TEDxNashvilleSalon


A german Professor of Electrolyte and circulatory research,trained as nephrologist,
and the conductor of the Sodium research that was part of MARS 500 aerospace research.


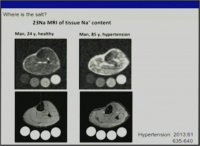
He is a critic of NaCl,and believes in the disorders that come from osmotically neutral sodium retention.
 
OP
Tristan Loscha
Joined
Dec 18, 2018
Messages
2,206
Image-dump.


Aufzeichnedggfn.JPG
 
OP
Tristan Loscha
Joined
Dec 18, 2018
Messages
2,206
..

Auffdfddzeichnen.JPG Aufzeichndfdfden.JPG Aufzeichnffdfden.JPG
Aufzeichdfddfdfnen.JPG

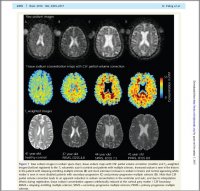
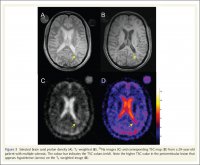
..ANG II gets reduced by high Sodium environment,MS has high brain Sodium,aggravating abated regen
of neuronal tissues after insult?
 
OP
Tristan Loscha
Joined
Dec 18, 2018
Messages
2,206
different presentation about the white gold:


Last edited:
OP
Tristan Loscha
Joined
Dec 18, 2018
Messages
2,206
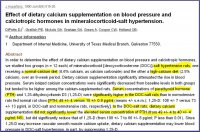
^^ 2nd Image of 3rd Spoiler: High Bodysodium increases PTH,without being
able to be brought down again with Ca.So PTH is resistive under
Na-stress in that animalmodel.

 
Last edited:
OP
Tristan Loscha
Joined
Dec 18, 2018
Messages
2,206
Cell Rep. Author manuscript; available in PMC 2017 Nov 7.
Published in final edited form as:
Cell Rep. 2017 Oct 24; 21(4): 1009–1020.
doi: 10.1016/j.celrep.2017.10.002
PMCID: PMC5674815
NIHMSID: NIHMS914066
PMID: 29069584
Dendritic Cell Amiloride-Sensitive Channels Mediate Sodium-Induced Inflammation and Hypertension
Natalia R. Barbaro,1,4 Jason D. Foss,1,4 Dmytro O. Kryshtal,1 Nikita Tsyba,1 Shivani Kumaresan,1 Liang Xiao,1 Raymond L. Mernaugh,3 Hana A. Itani,1 Roxana Loperena,2 Wei Chen,1 Sergey Dikalov,1 Jens M. Titze,1 Bjorn C. Knollmann,1 David G. Harrison,1,2 and Annet Kirabo1,2,5,6,*
Author information Copyright and License information Disclaimer
The publisher's final edited version of this article is available free at Cell Rep
See other articles in PMC that cite the published article.
Associated Data
Supplementary Materials
Go to:

SUMMARY
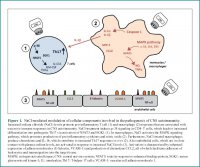
Sodium accumulates in the interstitium and promotes inflammation through poorly defined mechanisms. We describe a pathway by which sodium enters dendritic cells (DCs) through amiloride-sensitive channels including the alpha and gamma subunits of the epithelial sodium channel and the sodium hydrogen exchanger 1. This leads to calcium influx via the sodium calcium exchanger, activation of protein kinase C (PKC), phosphorylation of p47phox, and association of p47phox with gp91phox. The assembled NADPH oxidase produces superoxide with subsequent formation of immunogenic isolevuglandin (IsoLG)-protein adducts. DCs activated by excess sodium produce increased interleukin-1β (IL-1β) and promote T cell production of cytokines IL-17A and interferon gamma (IFN-γ). When adoptively transferred into naive mice, these DCs prime hypertension in response to a sub-pressor dose of angiotensin II. These findings provide a mechanistic link between salt, inflammation, and hypertension involving increased oxidative stress and IsoLG production in DCs.


In Brief


Barbaro et al. describe a pathway by which increased extracellular sodium activates dendritic cells. This pathway potentially explains the link between excessive salt intake, inflammation, and high blood pressure.

nihms914066u1.jpg


Dendritic Cell Amiloride-Sensitive Channels Mediate Sodium-Induced Inflammation and Hypertension

Cell Rep. Author manuscript; available in PMC 2017 Nov 7.
Published in final edited form as:
Cell Rep. 2017 Oct 24; 21(4): 1009–1020.
doi: 10.1016/j.celrep.2017.10.002
PMCID: PMC5674815
NIHMSID: NIHMS914066
PMID: 29069584
Dendritic Cell Amiloride-Sensitive Channels Mediate Sodium-Induced Inflammation and Hypertension
Natalia R. Barbaro,1,4 Jason D. Foss,1,4 Dmytro O. Kryshtal,1 Nikita Tsyba,1 Shivani Kumaresan,1 Liang Xiao,1 Raymond L. Mernaugh,3 Hana A. Itani,1 Roxana Loperena,2 Wei Chen,1 Sergey Dikalov,1 Jens M. Titze,1 Bjorn C. Knollmann,1 David G. Harrison,1,2 and Annet Kirabo1,2,5,6,*
Author information Copyright and License information Disclaimer
The publisher's final edited version of this article is available free at Cell Rep
See other articles in PMC that cite the published article.
Associated Data
Supplementary Materials
Go to:

SUMMARY
Sodium accumulates in the interstitium and promotes inflammation through poorly defined mechanisms. We describe a pathway by which sodium enters dendritic cells (DCs) through amiloride-sensitive channels including the alpha and gamma subunits of the epithelial sodium channel and the sodium hydrogen exchanger 1. This leads to calcium influx via the sodium calcium exchanger, activation of protein kinase C (PKC), phosphorylation of p47phox, and association of p47phox with gp91phox. The assembled NADPH oxidase produces superoxide with subsequent formation of immunogenic isolevuglandin (IsoLG)-protein adducts. DCs activated by excess sodium produce increased interleukin-1β (IL-1β) and promote T cell production of cytokines IL-17A and interferon gamma (IFN-γ). When adoptively transferred into naive mice, these DCs prime hypertension in response to a sub-pressor dose of angiotensin II. These findings provide a mechanistic link between salt, inflammation, and hypertension involving increased oxidative stress and IsoLG production in DCs.

Go to:
In Brief


Barbaro et al. describe a pathway by which increased extracellular sodium activates dendritic cells. This pathway potentially explains the link between excessive salt intake, inflammation, and high blood pressure.

Go to:
INTRODUCTION
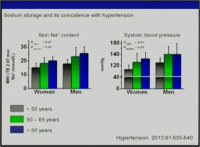
Hypertension affects over 1 billion people worldwide and is a major risk factor for death and disability (Kearney et al., 2005; Murray and Lopez, 2013). The etiology of most cases of hypertension is unknown and a large portion of hypertensive patients has elevated blood pressure despite extensive drug therapy (Benjamin et al., 2017). Over the past several years, it has become increasingly clear that inflammation contributes to the genesis of hypertension. Our laboratory and others have shown that cells of both the adaptive and innate immune systems contribute to this disease (McMaster et al., 2015). In particular, T cells with an effector phenotype infiltrate the kidneys and perivascular space in response to hypertensive stimuli, release inflammatory cytokines, and promote renal and vascular dysfunction leading to elevated blood pressure (Guzik et al., 2007; Madhur et al., 2010). Deletion of the recombinase-activating gene 1 lowers blood pressure and prevents renal injury in rats with salt-sensitive hypertension (Mattson et al., 2013). Humans with hypertension have increased numbers of circulating activated CD8+ T cells with a senescent phenotype (Youn et al., 2013), and interleukin-17A (IL-17A)-producing CD4+ T cells are increased in the circulation of humans with hypertension (Itani et al., 2016).

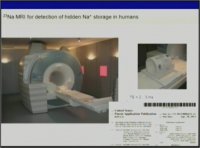
Another factor that contributes to the pathogenesis of hypertension is salt (NaCl). Dietary salt intake is positively correlated with blood pressure, and reductions in salt intake reduce blood pressure and cardiovascular events (Ha, 2014). The mechanisms underlying the relationship between salt and hypertension are not fully understood. Recent work by Titze and colleagues has shown that changes in extra-renal sodium handling can cause accumulation of sodium in the interstitium at levels that exceed that of plasma (Kopp et al., 2013; Machnik et al., 2009; Titze and Machnik, 2010). Using 23Na MRI, these investigators showed that blood pressure in humans is positively correlated with both skin and muscle sodium content (Kopp et al., 2013). Recent evidence suggests that these high sodium concentrations can alter immune cell function. Exposure of either mouse macrophages or T cells to high NaCl concentration drives them toward a pro-inflammatory state (Binger et al., 2015; Jantsch et al., 2015; Jörg et al., 2016; Kleinewietfeld et al., 2013; Wu et al., 2013; Zhang et al., 2015). Specifically, elevation of extracellular NaCl promotes production of IL-17A by T cells and salt feeding exacerbates experimental allergic encephalitis, a disease driven by this cytokine. Moreover, high-salt feeding in humans has been linked to increased monocyte numbers and increased plasma IL-23, which, in turn, can sustain IL-17 production by T cells (Yi et al., 2015). Of note, mice lacking IL-17A are partly protected from hypertension, and IL-17A can promote both renal and vascular dysfunction, leading to blood pressure elevation (Chiasson et al., 2011; Madhur et al., 2010; Nguyen et al., 2013).

T cells are activated when antigen-presenting cells, such as dendritic cells (DCs), macrophages, and B cells present antigens recognized by the T cell receptor. We recently elucidated a pathway by which DCs become activated and promote hypertension. We found that experimental hypertension is associated with an increase in NADPH-oxidase-dependent superoxide production in DCs, which leads to formation of highly reactive γ-ketoaldehydes, also known as isoketals or isolevuglandins (IsoLGs) (Kirabo et al., 2014). These rapidly adduct to self-proteins that are processed and presented as neoantigens by DCs, promoting an autoimmune-like state leading to renal and vascular dysfunction and hypertension. Moreover, DCs that accumulate IsoLGs produce large amounts of IL-6, IL-1β, and IL-23, which are known to promote differentiation of naive T cells into pro-inflammatory and pro-hypertensive IL-17A-producing cells (Madhur et al., 2010; Mills, 2008). In the present studies, we show that excessive salt promotes DC activation via increased superoxide production and IsoLG-protein adduct formation. This is due to increased activation of the NADPH oxidase, which is mediated by Ca2+/PKC-dependent phosphorylation of p47phox.

Go to:
RESULTS
High Salt Activates the NADPH Oxidase in DCs, Leading to Increased Superoxide Production through an Amiloride-Inhibitable Sodium Channel and Sodium-Calcium Exchanger
A predominant source of reactive oxygen species in phagocytic cells like DCs is the NADPH oxidase. We recently found that long-term angiotensin II infusion in mice increases NADPH-oxidase-dependent superoxide production in DCs resulting in the formation of immunogenic IsoLGs (Kirabo et al., 2014). To determine whether high salt affects the DC NADPH oxidase, we isolated splenic DCs from mice and cultured them for 24 hr in either normal-salt (150 mM NaCl) or high-salt media (190 mM NaCl). Exposure to the high-salt media markedly increased DC superoxide production as measured by electron spin resonance (ESR). Co-incubation with the peptide gp91 ds-tat, a competitive inhibitor of NADPH oxidase assembly, prevented the high-salt-induced production of superoxide (Figures 1A and 1B). In addition, we found that increasing extracellular NaCl from 150 to 190 mM increased intracellular sodium as measured by flow cytometry using sodium green (Figures 1C and 1D).

Figure 1
High Salt Activates the NADPH Oxidase in Dendritic Cells Leading to Increased Superoxide Production through an Amiloride-Inhibitable Sodium Channel and Sodium-Calcium Exchanger
Mouse splenic dendritic cells were isolated and cultured for 24 hr in either normal-salt (150 mM NaCl) or high-salt (190 mM NaCl) media with or without the NADPH oxidase inhibitor, gp91dstat. Superoxide production was then measured by electron spin resonance.

(A) Representative ESR signals showing the effect of high salt and gp91 ds-tat on dendritic cell superoxide production.

(B) Average data showing the effect of high salt and gp91 ds-tat on dendritic cell superoxide production.

(C) Flow cytometry representative histograms showing the effect of 15 min high-salt exposure on intracellular sodium.

(D) Average data showing the effect of high salt on intracellular sodium.

(E) qRT-PCR of sodium transporters: sodium-potassium-chloride cotransporter-1 (NKCC1), the sodium hydrogen exchangers (NHE1 and NHE6), the NCC, the sodium-calcium exchangers (NCX1 and NCX2), and the epithelial sodium channel (ENaC, α and γ subunits) on dendritic cells treated with normal or high salt.

(F) Effect of sodium transporter inhibitors on phosphorylation of p47phox.

(G) Western blot showing presence of the ENaC, α and γ subunits in dendritic cells treated with normal or high salt.

(H) Effect of amiloride and benzamil on the high-salt-induced association of p47phox and gp91phox.

(I) Effect of the Na+/H+ exchange inhibitor cariporide on the high-salt-induced association of p47phox and gp91phox.

(J) Effect of α-ENaC targeted siRNA and non-targeting siRNA on expression of α-ENaC.

(K) Effect of knockdown of α-ENaC on association of p47phox with gp91phox.

(L) Effect of NHE1 targeted siRNA and non-targeting siRNA on expression of NHE1.

(M) Effect of siRNA-mediated knockdown of NHE1 on the association of p47phox with gp91phox. (n = 5–6, *p < 0.05, **p < 0.01 versus normal-salt control, expressed as mean ± SEM).

To explore potential mechanisms by which sodium might enter DCs, we initially performed real-time RT-PCR for several known sodium transporters. This revealed mRNA expression of the sodium-potassium chloride cotransporter-1 (NKCC1), sodium hydrogen exchangers (NHE1 and NHE6), the sodium-chloride cotransporter (NCC), the sodium-calcium exchangers (NCX1 and NCX2), and the epithelial sodium channel (ENaC, α and γ subunits). The β subunit of ENaC was not present (data not shown). High salt did not significantly affect the amount of message observed for any transporter (Figure 1E).

To determine which of the sodium transporters facilitate the high-salt-induced activation of the NADPH oxidase, we pre-incubated mouse DCs with various inhibitors of these transporters and used phosphorylation of p47phox as an indicator of NADPH oxidase activation. Compared to normal salt, high salt markedly increased phosphorylation of p47phox as determined by western blot. While inhibition of NKCC with furosemide and NCC with hydrochlorothiazide did not have any effect, amiloride, which inhibits both ENaC and NHE, and KB-R7943 mesylate, a selective reverse mode NCX inhibitor, completely prevented the high-salt-induced phosphorylation of p47phox (Figure 1F). These results suggest that the effects of salt on DCs leading to phosphorylation of p47phox require activity of both NCX and an amiloride-inhibitable sodium channel such as either ENaC or NHE.

In additional experiments, we confirmed by western blot that both the alpha and gamma subunits of ENaC are indeed expressed by DCs (Figure 1G), while the beta subunit is not (data not shown). A key step in assembly of the NADPH oxidase is movement of p47phox to the membrane and its docking to gp91phox. To determine whether high salt causes assembly of the NADPH oxidase and whether this is mediated via ENaC, we immunoprecipitated gp91phox and performed western blots for associated p47phox. We found that compared to normal salt, high salt induced a striking association of p47phox with gp91phox and that this was prevented by co-incubation with amiloride and benzamil (Figure 1H). Since both amiloride and benzamil can also inhibit NHE, we used cariporide, a selective inhibitor of NHE and found that it also prevented the high-salt-induced association of p47phox with gp91phox (Figure 1I).

To confirm the specific involvement of ENaC in mediating the high-salt-induced activation of NADPH oxidase, we used small interfering RNA (siRNA) to specifically silence expression of α-ENaC in DCs. As shown in Figure 1J, this approach resulted in a marked reduction of α-ENaC expression in DCs and prevented association of p47phox with gp91phox (Figure 1K). Similarly, we achieved a marked siRNA-mediated knockdown of NHE1 (Figure 1L), and this also prevented association of p47phox with gp91phox (Figure 1M). Collectively, these results suggest that elevated sodium concentrations drive NADPH-oxidase-dependent superoxide production, and this is mediated through both ENaC and NHE.

The Salt-Induced Activation of the NADPH Oxidase in DCs Is Calcium and PKC Dependent
The NADPH oxidase subunit p47phox is phosphorylated by calcium-sensitive isoforms of protein kinase C (PKC) (Garcia et al., 1992; Papini et al., 1985). Since KB-R7943 mesylate, a selective reverse mode NCX inhibitor prevented the high-salt-induced phosphorylation of p47phox (Figure 1F), we hypothesized that excess sodium would lead to calcium influx and activation of PKC leading to activation of the NADPH oxidase. Using co-immunoprecipitation, we found that co-incubation with the selective cell permeant calcium chelator 1,2-bis(o-aminophenoxy) ethane-N,N,N′,N′-tetraacetic acid (BAPTA-AM) (Figure 2A) or the specific PKC inhibitor calphostin C (Figure 2B) prevented the salt-induced association of p47phox with gp91phox. In additional experiments, we monitored intracellular Ca2+ using fluorescence photometry (IonOptix) and found that 15 min of exposure to high salt leads to a marked increase in intracellular calcium (Figures 2C and 2D). Inhibition of the NCX using nickel chloride (NiCl2) prevented the salt-induced calcium increase in DCs (Figure 2D). In additional studies, we found that co-treatment with amiloride prevents the high-salt-induced Ca2+ influx (Figure 2E). These results indicate that high-salt exposure induces assembly of NADPH oxidase in DCs and that this is dependent on calcium entry via the NCX and PKC signaling.

Figure 2
Salt-Induced Activation of the NADPH Oxidase in Dendritic Cells Is Calcium- and PKC Dependent
Splenic dendritic cell lysates were immunoprecipitated for gp91phox, p47phox western blot was performed, the membranes were stripped, and gp91phox western blot was performed.

(A) Effect of BAPTA-AM on the high-salt-induced association of p47phox with gp91phox.

(B) Effect of the PKC inhibitor calphostin C on the high-salt-induced association of p47phox and gp91phox.

(C) Representative tracing showing intracellular Ca2+ in a single dendritic cell in response to high salt using fluorescence photometry (IonOptix).

(D) Average data showing the effect of the sodium calcium exchanger blocker, nickel chloride, on the high-salt-induced intracellular Ca2+ influx in dendritic cells.

(E) Average data showing the effect of amiloride on the high-salt-induced intracellular Ca2+ influx in dendritic cells (n = 3–12, *p < 0.05 versus normal-salt control, expressed as mean ± SEM).

High-Salt Exposure Activates DCs via Increased Production of Immunogenic IsoLGs
We have previously found that increased superoxide production in DCs is associated with DC activation and the accumulation of IsoLG-protein adducts (Kirabo et al., 2014). Therefore, we cultured mouse splenocytes in normal-salt media (150 mM NaCl), high-salt media (190 mM NaCl), or normal-salt media with mannitol (80 mM) added as an osmotic control for 24 hr and performed flow cytometry using a previously described gating strategy (Figure 3A), which discriminates macrophages from DCs (Jakubzick et al., 2013). Intracellular staining was performed with the single-chain antibody, D11 ScFv, which identifies IsoLG-protein adducts independent of the amino acid backbone (Figures 3B–3E) (Davies et al., 2004). We found that exposure to high salt but not mannitol increases IsoLG-adduct formation in DCs and macrophages (Figures 3B and 3C).

Figure 3
Excess Salt Induces Formation of Immunogenic IsoLGs and Expression of B7 Ligands in Dendritic Cells and Macrophages
Mouse splenocytes were cultured in normal-salt media (150 mM NaCl), high-salt media (190 mM NaCl), or normal-salt media with added mannitol (80 mM) as an osmotic control for 24 hr.

(A) Flow cytometry gating strategy to identify dendritic cells and macrophages.

(B and C) Flow cytometry representatives and average data showing intracellular staining for IsoLG-protein adducts in dendritic cells (B) and macrophages (C) using the single-chain antibody, D11 ScFv.

(D and E) Flow cytometry representatives and average data showing surface expression of CD86 in dendritic cells (D) and macrophages (E).

(F and G) Flow cytometry representatives and average data showing surface expression of CD80 in dendritic cells (F) and macrophages (G) (n = 5–6, *p < 0.05, **p < 0.01, ***p < 0.001 versus normal-salt control).

(H) Representative flow cytometry histograms showing the effect of salt on dendritic cells lacking the NADPH oxidase subunit p22phox.

(I) Average data showing the effect of salt on dendritic cells lacking the NADPH oxidase subunit p22phox (n = 6, **p < 0.01, expressed as mean ± SEM).

When DCs present antigens, they undergo a maturation process associated with increased expression of co-stimulatory molecules such as the B7 ligands CD80 and CD86, which we have shown to be essential for hypertension (Vinh et al., 2010). Using flow cytometry, we found that exposure to high salt, but not mannitol, increased surface expression of CD86 in DCs (Figure 3D). Likewise, macrophages had increased expression of CD86 in response to high salt but not mannitol (Figure 3E). Expression of CD80 was not different between treatment groups in both DCs (Figure 3F) and macrophages (Figure 3G).

To determine whether the high-salt-induced IsoLG formation is dependent on the NADPH oxidase, we created mice that lack the p22phox docking subunit of this enzyme complex in CD11c+ cells (tgCD11c-cre/p22phoxloxp/loxp). We used littermates with loxP sites but no Cre recombinase as controls (p22phoxloxp/loxp). DCs isolated from these two strains of mice were cultured for 24 hr in either normal salt or high salt, and flow cytometry was performed to determine the presence of IsoLGs. As shown in Figures 3H and 3I, high salt caused an increase in IsoLG-protein adducts in DCs from control mice, but DC-targeted deletion of p22phox prevented this salt-induced IsoLG formation. Collectively, these experiments suggest that the high-salt-induced formation of superoxide and IsoLGs in DCs is NADPH oxidase dependent.

An important aspect of DC activation is cytokine production. We isolated DCs from spleens of mice, cultured them in normal or high-salt media, and measured a panel of cytokines using a Luminex-based assay. We found that high-salt exposure significantly increased DC production of IL-1β (Figure 4A) and that there was a trend for an increase in IL-6 (Figure 4B) and tumor necrosis factor alpha (TNF-α) (Figure 4C). A complete panel of all the cytokines measured is shown in Table S1. To determine whether ENaC plays a role in activation of DCs leading to cytokine production, we co-incubated the DCs with amiloride during salt exposure. We found that amiloride completely prevented the high-salt-induced production of IL-1β (Figure 4D). These data collectively indicate that exposure to high salt induces the formation of IsoLGs in both DCs and macrophages and causes activation of these cells.

Figure 4
Dendritic Cells Exposed to High Salt Have Increased Production of IL-1b and IsoLG-Adducted Peptides in Their MHC
(A–C) Dendritic cells were isolated from spleens of mice, cultured in normal-salt or high-salt media and cytokines IL-1β (A), IL-6 (B), and TNF-α (C) were measured using a Luminex-based assay.

(D) Effect of amiloride on the high-salt-induced production of IL-1β.

(E) Surface peptides were eluted from dendritic cells treated with normal salt or high salt and dot blots were performed using the D-11 antibody.

(F) Total amount of peptides eluted.

(G) IsoLG-adducted peptides.

(H) Flow cytometry representative histogram showing the effect of amiloride on the high-salt-induced accumulation of IsoLG-adducted peptides in dendritic cells (FMO control is shown).

(I) Number of cells containing IsoLGs in normal-salt, high-salt, and high-salt + amiloride-treated dendritic cells.

(J) Percentage of cells containing isolevuglandins in normal-salt, high-salt, and high-salt + amiloride-treated dendritic cells (n = 5–10, *p < 0.05 versus normal-salt control, expressed as mean ± SEM).

To determine whether IsoLG-adducted peptides are presented in the major histocompatibility complexes (MHCs) of high-salt-exposed DCs, we eluted peptides from the surface of DCs treated with normal salt or high salt and performed dot blots using the D-11 antibody as shown in Figure 4E. While there was no significant difference in the total amount of peptides eluted from normal and high-salt-treated DCs (Figure 4F), the peptides obtained from high-salt-treated DCs were IsoLG adducted (Figure 4G), suggesting that salt-activated DCs process and present IsoLG-adducted peptides to T cells in their MHCs. In additional experiments, using flow cytometry and intracellular staining with the D11 antibody, we found that the high-salt-induced accumulation of IsoLGs in DCs in completely prevented by co-treatment with amiloride (Figures 4H–4J).

Exposure of DCs to High Salt Induces Pro-hypertensive Cytokine Production in Primed T Cells
To verify that DCs exposed to high salt had acquired the ability to activate and induce cytokine production among T cells, we first cultured them in normal or high-salt media. We then co-cultured these cells for 3 days with T cells isolated from mice in which salt-sensitive hypertension had been induced as previously described (Itani et al., 2016) (Figure 5A). Flow cytometry was performed to identify the CD4+ and CD8+ T cells subsets (Figure 5B). We used fluorescence minus one (FMO) gating controls (Figures 5C, 5E, 5G, and 5I, top panels) to determine intracellular staining for interferon (IFN)-γ and IL-17A production among the CD8+ and CD4+ T cells in response to DCs exposed to normal salt (Figures 5C, 5E, 5G, and 5I, middle panels) and high salt (Figures 5C, 5E, 5G, and 5I, bottom panels). As evident in Figures 5D, 5F, 5G, and 5J, DCs exposed to high salt were potent stimulators of IFN-γ and IL-17 production among both CD8+ and CD4+ T cells. However, DCs exposed to high salt were not able to stimulate IFN-γ and IL-17 production from T cells that had not been primed with salt-sensitive hypertension (Figure S1).

Figure 5
Dendritic Cells Exposed to High Salt Induce Production of Pro-hypertensive Cytokines by Primed T Cells
(A) Experimental strategy where dendritic cells were cultured in normal or high-salt media and then co-cultured with T cells isolated from mice that were exposed to repeated hypertensive challenges.

(B) Flow cytometry gating strategy to identify T cells subsets.

(C) Flow cytometry representatives showing intracellular staining for IFN-γ among CD8+ T cells in response to DCs treated with normal salt and high salt.

(D) Average data showing the effect of high-salt-treated dendritic cells on IFN-γ production among CD8+ cells.

(E) Flow cytometry representatives showing intracellular staining for IL-17 among CD8+ T cells in response to DCs treated with normal salt and high salt.

(F) Average data showing the effect of high-salt-treated dendritic cells on IL-17 production among CD8+ cells.

(G) Flow cytometry representatives showing intracellular staining for IFN-γ among CD4+ T cells in response to DCs treated with normal salt and high salt.

(H) Average data showing the effect of high-salt-treated dendritic cells on IFN-γ production among CD4+ cells.

(I) Flow cytometry representatives showing intracellular staining for IL-17 among CD4+ T cells in response to DCs treated with normal salt and high salt.

(J) Average data showing the effect of high-salt-treated dendritic cells on IL-17 production among CD4+ cells. The Flow-minus-one (FMO) gating controls are shown in the top panels (n = 5–8, *p < 0.05 versus normal-salt control, expressed as mean ± SEM).

Salt-Activated DCs Sensitize Mice to a Normally Suppressor Dose of Angiotensin II, Leading to Hypertension
To determine whether salt-activated DCs can drive hypertension, mouse splenic DCs were isolated and cultured for 24 hr in normal salt, high salt, or high salt plus the IsoLG scavenger 2-HOBA. These cells were then adoptively transferred into naive mice (1 × 10⁶ DCs per mouse) via intravenous injection. Radiotelemeters were implanted to measure blood pressure and heart rate. Two weeks later, osmotic mini-pumps were implanted subcutaneously to deliver a low dose of angiotensin II (140 mg/kg/hr). This experimental design is illustrated in Figure 6A. We found that the low dose of angiotensin II caused no increase in blood pressure in mice that received adoptive transfer of normal-salt-treated DCs; however, low-dose angiotensin II caused a significant increase in systolic (Figure 6B), diastolic (Figure 6C) and mean arterial pressure (Figure 6D), without affecting the heart rate (Figure 6E) in mice that received adoptive transfer of DCs exposed to high salt. The prohypertensive effect of high salt on DCs was prevented by scavenging of IsoLGs during the 24-hr culture (Figures 6B and 6C). These results suggest that high-salt-activated DCs prime mice to hypertension, and this is dependent on the formation of IsoLGs.

Figure 6
Salt-Activated Dendritic Cells Sensitize Mice to a Normally Suppressor Dose of Angiotensin II, Leading to Hypertension
(A) Dendritic cells were isolated from mouse spleens, cultured for 24 hr in normal salt, high salt, or high salt plus the isolevuglandin scavenger 2-HOBA and adoptively transferred into naive mice (106 DCs per mouse) via intravenous injection. Two weeks later, osmotic mini-pumps were implanted subcutaneously to deliver a low dose of angiotensin II (140 mg/kg/hr).

(B–E) Systolic (B), diastolic (C), mean arterial blood pressure (D), and heart rate (E) were monitored using radio-telemetry (n = 5–6, *p < 0.05 versus normal-salt control, expressed as mean ± SEM).

Go to:
DISCUSSION
The current studies have identified a novel pathway by which excess sodium contributes to inflammation and hypertension. Our results indicate that sodium entry into DCs is mediated through an amiloride-inhibitable sodium channel leading to intracellular calcium influx via the sodium-calcium exchanger and activation of PKC. PKC phosphorylates p47phox leading to assembly of the NADPH oxidase enzyme, increased superoxide production and immunogenic IsoLG formation in DCs. High-salt-treated DCs are activated as they have increased expression of the B7 ligand CD86 and production of the inflammatory cytokine IL-1β. When co-cultured with T cells, these DCs induce T cell production of pro-hypertensive cytokines IL-17 and IFN-γ.

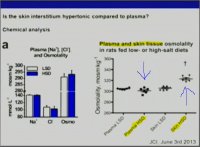
These studies are based on a new paradigm of salt balance that has emerged in recent years. In 2009, Machnik and colleagues showed that high-salt feeding of rodents increases interstitial concentrations of sodium in the skin to 190 mM without changing the plasma concentrations (Machnik et al., 2009; Titze et al., 2004). Subsequent studies using 23Na MRI showed that similar concentrations are reached in the skin and skeletal muscle interstitium of humans with hypertension and during aging (Kopp et al., 2013). Moreover, a link has been established between such high-salt concentrations and inflammation. Recent studies have shown that exposure to high salt drives both T cells and macrophages toward an inflammatory phenotype (Jörg et al., 2016; Kleinewietfeld et al., 2013; Zhang et al., 2015). High-salt intake in humans is associated with increased numbers of circulating monocytes and higher levels of inflammatory cytokines in the plasma (Yi et al., 2015).

A key finding of the present study is that increased superoxide production is critical for the pro-inflammatory effects of high salt on DCs. While there are a number of possible sources of superoxide in the DC, our studies show that the high-salt-mediated superoxide production is dependent on the NADPH oxidase. The activity of NADPH oxidase is driven by assembly of the cytosolic subunits p40phox, p47phox, and p67phox with the membrane-bound subunits p22phox and gp91phox. When p47phox is phosphorylated, the cytosolic subunits assemble with membrane components to form a functional enzyme complex. Our results suggest that high salt regulates NADPH oxidase activity by stimulating phosphorylation of p47phox. Phosphorylation of p47phox is an obligatory step required for the assembly of the subunit complex in the cytoplasm and subsequent translocation to cytochrome b558 (gp91phox and p22phox) at the cell membrane. We demonstrate for the first time that high salt induces association of p47phox with gp91phox. We previously showed that hypertension is associated with increased superoxide production in DCs and with increased IsoLG-protein adduct formation (Dixon et al., 2017; Kirabo et al., 2014). Our current findings illustrate a novel mechanism by which this process is stimulated by salt.

In the present studies, we focused on CD45+/MHC-II+ cells that are CD11b+/CD11c+. These are compatible with monocyte-derived DCs. We previously showed, while several subtypes of DCs accumulate isoLG-adducts, this monocyte-derived population is most potently affected in hypertension and indeed can prime hypertension following adoptive transfer (Kirabo et al., 2014). In the present study, we also show salt stimulates isoLG formation in splenic macrophages, which are a related cell type.

Importantly, we found that DCs express mRNA for a number of sodium channels including the sodium-potassium 2-chloride cotransporter (NKCC2), the sodium hydrogen exchangers NHE1 and NHE6, the NCC, the sodium-calcium exchangers (NCX1 and NCX2), and the epithelial sodium channel (ENaC, α and γ subunits). Inhibition of ENaC, NHE and NCX prevented the high-salt-induced activation of the NADPH oxidase. Amiloride and other ENaC inhibiting agents have been used clinically as diuretics for years. Our results suggest that these agents may have previously unidentified effects of inhibiting DC activation and ameliorating inflammation and have benefits beyond their natriuretic effects.

Interestingly, we found that DCs express only two subunits of ENaC (the α and γ subunits but not the β subunit). ENaC is normally expressed in the apical membrane of polarized epithelial cells including the distal nephron, colon, and the airway epithelium. Its function is best characterized in the distal nephron where it serves as the rate-limiting step for reabsorption of sodium under the control of aldosterone and vasopressin. Activating mutations of ENaC cause severe disturbances of Na+ homeostasis leading to hypertension in humans and in mouse models. In the kidney, ENaC is composed of three subunits including the α, β, and γ subunits. Although all these subunits are required to give maximal channel activity, several studies have demonstrated that in Xenopus oocytes, α2γ2 heterotetramers conduct 10%–15% of the activity observed with all three subunits (Bonny et al., 1999; Chang et al., 1996; Loffing et al., 2001; Rubera et al., 2003).

NCX can function in a forward mode, exchanging extracellular Na+ for intracellular Ca2+, or in reverse mode, depending on the Na+ and Ca2+ gradients across plasma membrane (Annunziato et al., 2004). Under physiological conditions, the main function of NCX is to extrude Ca2+ from cells. However, in pathophysiological conditions such as ischemia and early reperfusion, the higher intracellular Na+ concentrations can cause the NCX to function in reverse mode coupling Ca2+ influx with Na+ efflux (Imahashi et al., 2005; Kusuoka et al., 1993; Mattiello et al., 1998). In the present studies, we found that sodium entry into DCs in achieved through ENaC and NHE leading to increased intracellular Na+. This resulted in an initial brief reduction, followed by a subsequent influx of intracellular Ca2+ (Figures 2E and 2F), suggesting that, in the context of high-salt exposure, NCX in DCs switches from operating in forward mode to operating in the reverse mode. Indeed, our results suggest that the salt-mediated activation of the NADPH-oxidase is dependent on this intracellular Ca2+ influx as it was prevented by the cell permeant Ca2+-specific chelator, BAPTA, AM. The upstream pathways leading to activation of the NADPH oxidase vary considerably. One such pathway is phosphorylation of p47phox by Ca2+-dependent PKC isoforms. In keeping with this, the high-salt-induced activation of the NADPH oxidase was completely abolished by PKC inhibition with calphostin C (20 nM, Figure 2D).

A notable finding is that salt promoted production of IL-1β by DCs. This is in keeping with prior observations made by Shapiro and Dinarello, who showed that increased salt drives production of this cytokine by peripheral blood mononuclear cells (Shapiro and Dinarello, 1997). Interestingly, Zhang et al. recently showed that IL-1β receptor blockade blunts hypertension and salt retention by effects on NKCC2 in the nephron (Zhang et al., 2016). IL-1β contributes to priming T cells for production of IL-17A, which mediates hypertension and end-organ dysfunction (Madhur et al., 2010; Nguyen et al., 2013).

In conclusion, we have identified a previously unknown role of excess extracellular sodium in activating antigen-presenting DCs via formation of IsoLGs, which, in turn, promote hypertension. These findings provide insight into how elevated sodium microenvironments, such as those found in the interstitium of hypertensive animals and humans can lead to an inflammatory state and hypertension. Drugs that inhibit sodium entry into DCs may have previously unknown antioxidant and anti-inflammatory properties.

Go to:
EXPERIMENTAL PROCEDURES
Animals
Wild-type C57BL/6 mice were obtained from Jackson Laboratories. All experiments were performed in male animals at approximately 3 months of age. Osmotic mini-pumps (Alzet, Model 2002) were implanted for infusion of low-dose angiotensin II (140 ng/kg/min) for 2 weeks. Blood pressure was monitored invasively using radio-telemetry as previously described (Guzik et al., 2007; Kirabo et al., 2011a, 2011b). After telemetry implantation, mice were allowed to recover for 10 days before osmotic mini-pumps were placed. Adoptive transfer of DCs was accomplished by injection 1 × 10⁶ DCs in 100 µL of sterile physiological buffered saline via the retro-orbital vein in mice anesthetized with 2% isoflurane. Angiotensin II infusion was started 10 days after adoptive transfer of DCs. The L-NAME high-salt protocol was performed as previously described (Itani et al., 2016). Briefly, at 12 weeks of age, male mice were randomly selected to initially receive L-NAME (0.5 mg/mL, Abcam 120136) in the drinking water for 2 weeks. This was followed by a 2-week washout period when the mice were given regular water and chow ad libitum. The mice were then fed a high-salt diet (4% NaCl, Teklad TD.92034) for 3 weeks. Mice were sacrificed at the end of all experiments by CO2 inhalation. All animal procedures were approved by Vanderbilt University’s Institutional Animal Care and Use Committee, and the mice were housed and cared for in accordance with the Guide for the Care and Use of Laboratory Animals, US Department of Health and Human Services.

Splenocyte and DC Isolation and Culture
Mouse splenic DCs were isolated using magnetic-activated cell sorting (MACS). Mice were euthanized with CO2, and spleens were removed and placed in spleen dissociation buffer in C tubes (Miltenyi). Spleens were dissociated using homogenizer (Miltenyi) and incubated at 37°C for 15 min. Homogenate was then passed through a 40-µM cell strainer and washed with Dulbecco’s PBS (dPBS). For splenocyte experiments, this single-cell suspension was then cultured for 24 hr in either control RPMI media (150 mmol/L Na+) or media containing 190 mmol/L Na+. To control for hyperosmolality, other cells were exposed to mannitol (190 mmol/L). For DC-specific experiments, DCs were then isolated from this single-cell suspension using the CD11c isolation kit (Miltenyi). For T cell activation experiments, DCs were cultured with T cells (Pan T Cell Isolation Kit II, mouse, 130-095-130) isolated from mice with repeated hypertensive stimuli challenges for 3 days.

Flow Cytometry
DCs were analyzed by flow cytometry using the following antibodies; PerCP-Cy5.5 anti-CD45; Amcyan anti-CD45; PE-Cy7 anti-I-Ab; PerCP-Cy5.5 anti-CD11c; APC-Cy7 anti-CD11b; PE anti MertK, and APC anti CD64 (Becton Dickinson). We used intracellular staining with the single-chain antibody D-11 to detect IsoLG protein adducts. D-11 is a single-chain antibody that was developed by phage display screening of literally millions of single chains to identify one that reacts with isoLGs adducted to any peptide backbone (Davies et al., 2004). The D11 ScFv antibody was labeled with a fluorochrome using the APEXTM Alexa Fluor 488 Antibody Labeling kit (Invitrogen). The cells labeled with surface antibodies were then fixed and permeabilized for intracellular detection of IsoLGs using a cell permeabilization kit (Invitrogen). For T cell analysis, the following antibodies were used: Brilliant Violet 510 (BV510)-conjugated anti-CD45 antibody (BioLegend), peridinin chlorophyll proteincyanin-5.5 (PerCP-Cy5.5)-conjugated anti-CD3 antibody (BioLegend), phycoerythrin-cyanin-7(PE-Cy7)-conjugated anti-CD8 antibody (BioLegend), and allophycocyanin-Hilite-7 (APC-H7)-conjugated anti-CD4 antibody (BD Biosciences). Intracellular staining for IL-17A and IFN-γ were performed as previously described (Itani et al., 2016; Kamat et al., 2015). Briefly, T cells were suspended in RPMI medium supplemented with 5% FBS and stimulated with 2 µL of BD Leukocyte Activation Cocktail (ionomycin and phorbol myristic acetate (PMA) along with the Golgi inhibitor, brefeldin A) at 37°C for 5 hr. Surface staining was performed as described above followed by intracellular staining using fluorescein isothiocyanate (FITC)-conjugated anti-IFN-γ antibody (eBioscience) or PE-conjugated anti-IL-17A. The cells were then washed 3 times and immediately analyzed on a FACSCanto flow cytometer with DIVA software (Becton Dickinson). Dead cells were eliminated from the analysis using 7-AAD (BD Pharmingen). For each experiment, we gated on single live cells and used flow minus one (FMO) controls for each fluorophore to establish the gates. Data analysis was done using FlowJo software (Tree Star).

Weak Acid Elution of DC MHC-Associated Peptides
DCs were placed in citrate-phosphate buffer at pH 3.3 containing aprotinin and iodoacetamide (1:100) to elute MHC-I-bound peptides. The peptides were then be passed through ultrafiltration devices (Amicon Ultra; Millipore) to isolate peptides <5,000 Da and to remove beta-2 microglobulin (β2 m) proteins. The concentration of the peptides in the resulting flow-through was determined using a nanodrop and analyzed by dot blot using the D-11 antibody.

ESR Measurements of Superoxide Production in DCs
DCs were isolated from the spleen of C57BL/6 mice and placed in the RPMI cell-culture media in the presence of normal (140 mM) or high NaCl (190 mM) for 24 hr. Cells were placed in 24-well plate with 2 million cells per well. Some cells were supplemented with peptide gp91 ds-tat (50 µM, GenScript) which inhibits assembly of the NADPH oxidase enzyme. After 24 hr, cells were resuspended and treated spin probe TMH (0.5 mM) and chelating agent DTPA (0.1 mM) as we have previously described (Dikalov et al., 2011). Following 30-min incubation, cells were transferred in a 1-mL insulin syringe and snap-frozen in the liquid nitrogen. Then frozen cells were placed in the quartz Dewar with the liquid nitrogen and analyzed by Bruker EMX ESR spectrometer. Accumulation of superoxide-TMH nitroxide product was determined from the intensity of ESR signal using standard calibration obtained with TEMPOL nitroxide. Superoxide specificity of ESR signal was confirmed by inhibition with the NADPH oxidase inhibitor peptide gp91 ds-tat (Dikalov et al., 2014).

Real-Time RT-PCR
The total RNA was extracted using QIAzolLysis Reagent (QIAGEN) according to manufacturer’s instructions. The concentration and purity of the isolated RNA were determined using UV spectrophotometry (DeNovix Spectrophotometer). Reverse transcription was performed using TaqMan Reverse Transcription Reagents (Life Technologies) using 1 µg of total RNA. Real-time RT-PCR was performed using TaqMan Gene Expression Assays. Gene expression values were calculated based on the comparative Ct normalized to the expression values of GAPDH mRNA and displayed as fold induction. The PCR parameters were: an initial denaturation (one cycle at 95°C for 10 min); denaturation at 95°C for 10 s, annealing and amplification at 60°C for 30 s for 40 cycles; and a melting curve, 72°C, with the temperature gradually increasing (0.5°C) to 95°C.

Intracellular Sodium Measurements
Intracellular Na+ was measured with the sodium-sensitive fluorescent probe, sodium green (Molecular Probes), using flow cytometry as described previously (Sugishita et al., 2001). Briefly, cells were loaded with 5 µmol/L sodium green AM in HEPES solution for 60 min at 37°C. Loaded cells were then washed and incubated in dye-free HEPES solution for 10 min. The cells were separated into aliquots and exposed to either normal (150 mM NaCl) or high salt (190 mM NaCl) for 15 min. The cells were then immediately analyzed by flow cytometry on a FACSCanto flow cytometer with DIVA software (Becton Dickinson). Dead cells were eliminated from the analysis using 7-AAD (BD Pharmingen). Cells that were not loaded with the sodium green fluorescent probe were used as controls to establish the gates. Data analysis was done using FlowJo software (Tree Star).

Immunoblotting
Immunoprecipitation and western blot analysis were performed as previously described (Sayeski et al., 1998). To determine phosphorylation of p47phox, protein sample was extracted from the homogenates of isolated DCs and immunoprecipitated using p47phox antibody (Millipore) followed by western blotting using phospho-p47phox antibody (Sigma). To investigate association of p47phox with gp91phox, protein lysates from DCs were immunoprecipitated using the gp91phox antibody (Becton Dickinson) followed by western blotting using phospho-p47phox antibody (Millipore).

Ca2+ Fluorescence Measurements
DCs were isolated as described above and rested overnight in RPMI media. The cells were then loaded with membrane-permeable Ca2+-sensitive fluorescent indicator Fluo-4 AM. Cells were incubated in Tyrode’s solution (in mM: NaCl 140, KCl 5.4, MgCl2 1, glucose 10, HEPES 10), containing 1 mM Ca2+, 6.6 µM fluo-4 AM, and 0.16% Pluronic F127 for 20 min at room temperature to load indicator in the cytosol. Then the supernatant was removed, and cells were washed in Tyrode’s solution, containing 1 mM Ca2+, twice for 15 min. After that, the cells were placed into the experimental chamber superfused with 2 mM Ca2+ Tyrode’s solution. Intracellular Ca2+ was measured using fluorescence photometry setup (IonOptix). Ca2+ fluorescence was first measured after 3–5 min in normal salt (140 mmol/L Na+), and then solution was changed to high salt (190 mmol/L Na) and Ca2+ fluorescence was monitored in 3-min intervals for another 21–24 min. All experiments were conducted at room temperature (≈23°C). Intracellular Ca2+ was analyzed using commercial software (IonWizard; IonOptix). A total of 7–12 DCs from nine different animals were used.

siRNA Experiments
Mouse splenic DCs were isolated using MACS. Four million cells were re-suspended in 1 mL of Accell siRNA delivery medium (GE Healthcare Dharmacon) supplemented with 2.5% FBS, 1 mM sodium pyruvate and 25 mM HEPES. Cells were incubated for 72 hr with 1 µM Acell SMART pool of siRNA targeting mouse NHE1 (Slc9a1 siRNA [E-048336-00-0005], or Alpha ENaC (Scnn1a [E-040678-00-0005] GE Healthcare Dharmacon). ON-TARGETplus Non-targeting Control siRNA (D-001810-01-05) was used as a negative control. Sodium chloride (40 mM) was added for additional 24 hr. The knockdown levels of Alpha ENaC and NHE1 were analyzed by western blot.

Inhibitors
Furosemide (20 µM Tocris Bioscience), hydrochlorothiazide (20 µM, Sigma), amiloride (20 µM, Tocris Bioscience), benzamil hydrochloride hydrate (10 µM, Sigma), KB-R7943 mesylate (2 nM, Tocris Bioscience), 1,2-bis(o-aminophenoxy) ethane-N,N,N′,N′-tetraacetic acid (BAPTA, AM) (Tocris Bioscience), calphostin C (20 nM, Sigma), cariporide (10 µM, Sigma), and nickel chloride (NiCl2) (10 mM, Sigma).

Statistical Analysis
All data are expressed as mean ± SEM. Comparisons made between 2 variables were performed using Student’s t tests. One-way ANOVA was used to compare 3 or more independent groups with post hoc analysis Tukey’s post hoc test, while repeated-measures ANOVA was used to compare changes in blood pressure over time. The level of significance (α) accepted was less than 0.05.

Highlights


  • Increased extracellular sodium is transported into DCs by amiloride-sensitive channels

  • Sodium is exchanged for calcium, activating O2·− formation by the NADPH oxidase

  • Enhanced O2·− in DCs leads to formation of isolevuglandin protein adducts

  • Salt-stimulated DCs produce pro-inflammatory cytokines and drive T cell activation
Go to:
Supplementary Material
1
Click here to view.(149K, pdf)
Go to:
Acknowledgments
This work was supported by American Heart Association grants POST290900 and SFRN204200, National Institutes of Health grants K01HL130497, R01HL125865, and R01HL039006, and the National Center for Advancing Translational Sciences (UL1TR000445). We thank Kala B. Dixon and Anica Mohammadkhah for the technical help with experiments.

Go to:
Footnotes
SUPPLEMENTAL INFORMATION

Supplemental Information includes one figure and one table and can be found with this article online at Redirecting.

AUTHOR CONTRIBUTIONS

N.R.B., J.D.F., D.O.K., N.T., S.K., L.X., R.L.M., H.A.I., R.L., W.C., S.D., and A.K. performed the experiments. N.R.B., J.M.T., D.G.H., and A.K. conceived the research program, designed experiments, and wrote the manuscript. J.M.T., B.C.K., A.K., and D.G.H. edited and approved the manuscript. N.R.B., D.G.H., and K.A. obtained funding for the manuscript.
Go to:
References
  • Annunziato L, Pignataro G, Di Renzo GF. Pharmacology of brain Na+/Ca2+ exchanger: From molecular biology to therapeutic perspectives. Pharmacol. Rev. 2004;56:633–654. [PubMed] [Google Scholar]
  • Benjamin EJ, Blaha MJ, Chiuve SE, Cushman M, Das SR, Deo R, de Ferranti SD, Floyd J, Fornage M, Gillespie C, et al. American Heart Association Statistics, C.; Stroke Statistics, S Heart disease and stroke statistics-2017 update: a report from the American Heart Association. Circulation. 2017;135:e146–e603. [PMC free article] [PubMed] [Google Scholar]
  • Binger KJ, Gebhardt M, Heinig M, Rintisch C, Schroeder A, Neuhofer W, Hilgers K, Manzel A, Schwartz C, Kleinewietfeld M, et al. High salt reduces the activation of IL-4- and IL-13-stimulated macrophages. J. Clin. Invest. 2015;125:4223–4238. [PMC free article] [PubMed] [Google Scholar]
  • Bonny O, Chraibi A, Loffing J, Jaeger NF, Gründer S, Horisberger JD, Rossier BC. Functional expression of a pseudohypoaldosteronism type I mutated epithelial Na+ channel lacking the pore-forming region of its alpha subunit. J. Clin. Invest. 1999;104:967–974. [PMC free article] [PubMed] [Google Scholar]
  • Chang SS, Grunder S, Hanukoglu A, Rösler A, Mathew PM, Hanukoglu I, Schild L, Lu Y, Shimkets RA, Nelson-Williams C, et al. Mutations in subunits of the epithelial sodium channel cause salt wasting with hyperkalaemic acidosis, pseudohypoaldosteronism type 1. Nat. Genet. 1996;12:248–253. [PubMed] [Google Scholar]
  • Chiasson VL, Talreja D, Young KJ, Chatterjee P, Banes-Berceli AK, Mitchell BM. FK506 binding protein 12 deficiency in endothelial and hematopoietic cells decreases regulatory T cells and causes hypertension. Hypertension. 2011;57:1167–1175. [PMC free article] [PubMed] [Google Scholar]
  • Davies SS, Talati M, Wang X, Mernaugh RL, Amarnath V, Fessel J, Meyrick BO, Sheller J, Roberts LJ., 2nd Localization of isoketal adducts in vivo using a single-chain antibody. Free Radic. Biol. Med. 2004;36:1163–1174. [PubMed] [Google Scholar]
  • Dikalov SI, Kirilyuk IA, Voinov M, Grigor’ev IA. EPR detection of cellular and mitochondrial superoxide using cyclic hydroxylamines. Free Radic. Res. 2011;45:417–430. [PMC free article] [PubMed] [Google Scholar]
  • Dikalov SI, Nazarewicz RR, Bikineyeva A, Hilenski L, Lassegue B, Griendling KK, Harrison DG, Dikalova AE. Nox2-induced production of mitochondrial superoxide in angiotensin II-mediated endothelial oxidative stress and hypertension. Antioxid. Redox. Signal. 2014;20:281–294. [PMC free article] [PubMed] [Google Scholar]
  • Dixon KB, Davies SS, Kirabo A. Dendritic cells and isolevuglandins in immunity, inflammation and hypertension. Am. J .Physiol. Heart Circ. Physiol. 2017;312:H368–H374. [PMC free article] [PubMed] [Google Scholar]
  • Garcia RC, Whitaker M, Heyworth PG, Segal AW. Okadaic acid produces changes in phosphorylation and translocation of proteins and in intracellular calcium in human neutrophils. Relationship with the activation of the NADPH oxidase by different stimuli. Biochem. J. 1992;286:687–692. [PMC free article] [PubMed] [Google Scholar]
  • Guzik TJ, Hoch NE, Brown KA, McCann LA, Rahman A, Dikalov S, Goronzy J, Weyand C, Harrison DG. Role of the T cell in the genesis of angiotensin II induced hypertension and vascular dysfunction. J. Exp. Med. 2007;204:2449–2460. [PMC free article] [PubMed] [Google Scholar]
  • Ha SK. Dietary salt intake and hypertension. Electrolyte Blood Press. 2014;12:7–18. [PMC free article] [PubMed] [Google Scholar]
  • Imahashi K, Pott C, Goldhaber JI, Steenbergen C, Philipson KD, Murphy E. Cardiac-specific ablation of the Na+-Ca2+ exchanger confers protection against ischemia/reperfusion injury. Circ. Res. 2005;97:916–921. [PubMed] [Google Scholar]
  • Itani HA, Xiao L, Saleh MA, Wu J, Pilkinton MA, Dale BL, Barbaro NR, Foss JD, Kirabo A, Montaniel KR, et al. CD70 exacerbates blood pressure elevation and renal damage in response to repeated hypertensive stimuli. Circ. Res. 2016;118:1233–1243. [PMC free article] [PubMed] [Google Scholar]
  • Jakubzick C, Gautier EL, Gibbings SL, Sojka DK, Schlitzer A, Johnson TE, Ivanov S, Duan Q, Bala S, Condon T, et al. Minimal differentiation of classical monocytes as they survey steady-state tissues and transport antigen to lymph nodes. Immunity. 2013;39:599–610. [PMC free article] [PubMed] [Google Scholar]
  • Jantsch J, Schatz V, Friedrich D, Schröder A, Kopp C, Siegert I, Maronna A, Wendelborn D, Linz P, Binger KJ, et al. Cutaneous Na+ storage strengthens the antimicrobial barrier function of the skin and boosts macrophage-driven host defense. Cell Metab. 2015;21:493–501. [PMC free article] [PubMed] [Google Scholar]
  • Jörg S, Kissel J, Manzel A, Kleinewietfeld M, Haghikia A, Gold R, Müller DN, Linker RA. High salt drives Th17 responses in experimental autoimmune encephalomyelitis without impacting myeloid dendritic cells. Exp. Neurol. 2016;279:212–222. [PubMed] [Google Scholar]
  • Kamat NV, Thabet SR, Xiao L, Saleh MA, Kirabo A, Madhur MS, Delpire E, Harrison DG, McDonough AA. Renal transporter activation during angiotensin-II hypertension is blunted in interferon-γ−/− and interleukin-17A−/− mice. Hypertension. 2015;65:569–576. [PMC free article] [PubMed] [Google Scholar]
  • Kearney PM, Whelton M, Reynolds K, Muntner P, Whelton PK, He J. Global burden of hypertension: Analysis of worldwide data. Lancet. 2005;365:217–223. [PubMed] [Google Scholar]
  • Kirabo A, Kearns PN, Jarajapu YP, Sasser JM, Oh SP, Grant MB, Kasahara H, Cardounel AJ, Baylis C, Wagner KU, Sayeski PP. Vascular smooth muscle Jak2 mediates angiotensin II-induced hypertension via increased levels of reactive oxygen species. Cardiovasc. Res. 2011a;91:171–179. [PMC free article] [PubMed] [Google Scholar]
  • Kirabo A, Oh SP, Kasahara H, Wagner KU, Sayeski PP. Vascular smooth muscle Jak2 deletion prevents angiotensin II-mediated neo-intima formation following injury in mice. J. Mol. Cell. Cardiol. 2011b;50:1026–1034. [PMC free article] [PubMed] [Google Scholar]
  • Kirabo A, Fontana V, de Faria AP, Loperena R, Galindo CL, Wu J, Bikineyeva AT, Dikalov S, Xiao L, Chen W, et al. DC isoketal-modified proteins activate T cells and promote hypertension. J. Clin. Invest. 2014;124:4642–4656. [PMC free article] [PubMed] [Google Scholar]
  • Kleinewietfeld M, Manzel A, Titze J, Kvakan H, Yosef N, Linker RA, Muller DN, Hafler DA. Sodium chloride drives autoimmune disease by the induction of pathogenic TH17 cells. Nature. 2013;496:518–522. [PMC free article] [PubMed] [Google Scholar]
  • Kopp C, Linz P, Dahlmann A, Hammon M, Jantsch J, Müller DN, Schmieder RE, Cavallaro A, Eckardt KU, Uder M, et al. 23Na magnetic resonance imaging-determined tissue sodium in healthy subjects and hypertensive patients. Hypertension. 2013;61:635–640. [PubMed] [Google Scholar]
  • Kusuoka H, Camilion de Hurtado MC, Marban E. Role of sodium/calcium exchange in the mechanism of myocardial stunning: Protective effect of reperfusion with high sodium solution. J. Am. Coll. Cardiol. 1993;21:240–248. [PubMed] [Google Scholar]
  • Loffing J, Zecevic M, Féraille E, Kaissling B, Asher C, Rossier BC, Firestone GL, Pearce D, Verrey F. Aldosterone induces rapid apical translocation of ENaC in early portion of renal collecting system: Possible role of SGK. Am. J. Physiol. Renal Physiol. 2001;280:F675–F682. [PubMed] [Google Scholar]
  • Machnik A, Neuhofer W, Jantsch J, Dahlmann A, Tammela T, Machura K, Park JK, Beck FX, Müller DN, Derer W, et al. Macrophages regulate salt-dependent volume and blood pressure by a vascular endothelial growth factor-C-dependent buffering mechanism. Nat. Med. 2009;15:545–552. [PubMed] [Google Scholar]
  • Madhur MS, Lob HE, McCann LA, Iwakura Y, Blinder Y, Guzik TJ, Harrison DG. Interleukin 17 promotes angiotensin II-induced hypertension and vascular dysfunction. Hypertension. 2010;55:500–507. [PMC free article] [PubMed] [Google Scholar]
  • Mattiello JA, Margulies KB, Jeevanandam V, Houser SR. Contribution of reverse-mode sodium-calcium exchange to contractions in failing human left ventricular myocytes. Cardiovasc. Res. 1998;37:424–431. [PubMed] [Google Scholar]
  • Mattson DL, Lund H, Guo C, Rudemiller N, Geurts AM, Jacob H. Genetic mutation of recombination activating gene 1 in Dahl salt-sensitive rats attenuates hypertension and renal damage. Am. J. Physiol. Regul. Integr. Comp. Physiol. 2013;304:R407–R414. [PMC free article] [PubMed] [Google Scholar]
  • McMaster WG, Kirabo A, Madhur MS, Harrison DG. Inflammation, immunity, and hypertensive end-organ damage. Circ. Res. 2015;116:1022–1033. [PMC free article] [PubMed] [Google Scholar]
  • Mills KH. Induction, function and regulation of IL-17-producing T cells. Eur. J. Immunol. 2008;38:2636–2649. [PubMed] [Google Scholar]
  • Murray CJ, Lopez AD. Measuring the global burden of disease. N. Engl. J. Med. 2013;369:448–457. [PubMed] [Google Scholar]
  • Nguyen H, Chiasson VL, Chatterjee P, Kopriva SE, Young KJ, Mitchell BM. Interleukin-17 causes Rho-kinase-mediated endothelial dysfunction and hypertension. Cardiovasc. Res. 2013;97:696–704. [PMC free article] [PubMed] [Google Scholar]
  • Papini E, Grzeskowiak M, Bellavite P, Rossi F. Protein kinase C phosphorylates a component of NADPH oxidase of neutrophils. FEBS Lett. 1985;190:204–208. [PubMed] [Google Scholar]
  • Rubera I, Loffing J, Palmer LG, Frindt G, Fowler-Jaeger N, Sauter D, Carroll T, McMahon A, Hummler E, Rossier BC. Collecting duct-specific gene inactivation of alphaENaC in the mouse kidney does not impair sodium and potassium balance. J. Clin. Invest. 2003;112:554–565. [PMC free article] [PubMed] [Google Scholar]
  • Sayeski PP, Ali MS, Harp JB, Marrero MB, Bernstein KE. Phosphorylation of p130Cas by angiotensin II is dependent on c-Src, intracellular Ca2+, and protein kinase. C. Circ. Res. 1998;82:1279–1288. [PubMed] [Google Scholar]
  • Shapiro L, Dinarello CA. Hyperosmotic stress as a stimulant for proinflammatory cytokine production. Exp. Cell Res. 1997;231:354–362. [PubMed] [Google Scholar]
  • Sugishita K, Su Z, Li F, Philipson KD, Barry WH. Gender influences [Ca(2+)](i) during metabolic inhibition in myocytes overexpressing the Na(+)-Ca(2+) exchanger. Circulation. 2001;104:2101–2106. [PubMed] [Google Scholar]
  • Titze J, Machnik A. Sodium sensing in the interstitium and relationship to hypertension. Curr. Opin. Nephrol. Hypertens. 2010;19:385–392. [PubMed] [Google Scholar]
  • Titze J, Shakibaei M, Schafflhuber M, Schulze-Tanzil G, Porst M, Schwind KH, Dietsch P, Hilgers KF. Glycosaminoglycan polymerization may enable osmotically inactive Na+ storage in the skin. Am. J. Physiol. Heart Circ. Physiol. 2004;287:H203–H208. [PubMed] [Google Scholar]
  • Vinh A, Chen W, Blinder Y, Weiss D, Taylor WR, Goronzy JJ, Weyand CM, Harrison DG, Guzik TJ. Inhibition and genetic ablation of the B7/CD28 T-cell costimulation axis prevents experimental hypertension. Circulation. 2010;122:2529–2537. [PMC free article] [PubMed] [Google Scholar]
  • Wu C, Yosef N, Thalhamer T, Zhu C, Xiao S, Kishi Y, Regev A, Kuchroo VK. Induction of pathogenic TH17 cells by inducible salt-sensing kinase SGK1. Nature. 2013;496:513–517. [PMC free article] [PubMed] [Google Scholar]
  • Yi B, Titze J, Rykova M, Feuerecker M, Vassilieva G, Nichiporuk I, Schelling G, Morukov B, Choukèr A. Effects of dietary salt levels on monocytic cells and immune responses in healthy human subjects: A longitudinal study. Transl. Res. 2015;166:103–110. [PMC free article] [PubMed] [Google Scholar]
  • Youn JC, Yu HT, Lim BJ, Koh MJ, Lee J, Chang DY, Choi YS, Lee SH, Kang SM, Jang Y, Yoo OJ, Shin EC, Park S. Immunosenescent CD8+ T cells and C-X-C chemokine receptor type 3 chemokines are increased in human hypertension. Hypertension. 2013;62:126–133. [PubMed] [Google Scholar]
  • Zhang WC, Zheng XJ, Du LJ, Sun JY, Shen ZX, Shi C, Sun S, Zhang Z, Chen XQ, Qin M, et al. High salt primes a specific activation state of macrophages, M(Na) Cell Res. 2015;25:893–910. [PMC free article] [PubMed] [Google Scholar]
  • Zhang J, Rudemiller NP, Patel MB, Karlovich NS, Wu M, McDonough AA, Griffiths R, Sparks MA, Jeffs AD, Crowley SD. Interleukin-1 receptor activation potentiates salt reabsorption in angiotensin II-induced hypertension via the NKCC2 co-transporter in the nephron. Cell Metab. 2016;23:360–368. [PMC free article] [PubMed] [Google Scholar]
 
Last edited:
OP
Tristan Loscha
Joined
Dec 18, 2018
Messages
2,206
Oncotarget. 2018 May 18; 9(38): 25193–25205.
Published online 2018 May 18. doi: 10.18632/oncotarget.25391
PMCID: PMC5982760
PMID: 29861863
High salt induces P-glycoprotein mediated treatment resistance in breast cancer cells through store operated calcium influx
Duaa Babaer,1 Suneetha Amara,2 Michael Ivy,1 Yan Zhao,3 Philip E. Lammers,4 Jens M. Titze,3,5 and Venkataswarup Tiriveedhi1,6
Author information Article notes Copyright and License information Disclaimer
This article has been cited by other articles in PMC.
Go to:
Abstract
Recent evidence from our laboratory has demonstrated that high salt (Δ0.05 M NaCl) induced inflammatory response and cancer cell proliferation through salt inducible kinase-3 (SIK3) upregulation. As calcium influx is known to effect inflammatory response and drug resistance, we examined the impact of high salt on calcium influx in breast cancer cells. Treatment of MCF-7 and MDA-MB-231 cells with high salt induced an enhanced intracellular calcium intensity, which was significantly decreased by store operated calcium entry (SOCE) inhibitor co-treatment. Further, high salt induced P-glycoprotein (P-gp) mediated paclitaxel drug resistance in breast cancer cells. Murine tumor studies demonstrated that injection of MCF-7 cells cultured in high salt, exerted higher tumorigenicity compared to the basal cultured counterpart. Knock down of SIK3 by specific shRNA inhibited tumorigenicty, expression of SOCE regulators and P-gp activity, suggesting SIK3 is an upstream mediator of SOCE induced calcium influx. Furthermore, small molecule inhibitor, prostratin, exerted anti-tumor effect in murine models through SIK3 inhibition. Taken together, we conclude that SIK3 is an upstream regulator of store operated calcium entry proteins, Orai1 and STIM1, and mediates high salt induced inflammatory cytokine responses and P-gp mediated drug resistance. Therefore, small molecule inhibitors, such as prostratin, could offer novel anti-cancer approaches.

Keywords: breast cancer, salt, P-glycoprotein, store operated calcium entry, prostratin


High salt induces P-glycoprotein mediated treatment resistance in breast cancer cells through store operated calcium influx


Oncotarget. 2018 May 18; 9(38): 25193–25205.
Published online 2018 May 18. doi: 10.18632/oncotarget.25391
PMCID: PMC5982760
PMID: 29861863
High salt induces P-glycoprotein mediated treatment resistance in breast cancer cells through store operated calcium influx
Duaa Babaer,1 Suneetha Amara,2 Michael Ivy,1 Yan Zhao,3 Philip E. Lammers,4 Jens M. Titze,3,5 and Venkataswarup Tiriveedhi1,6
Author information Article notes Copyright and License information Disclaimer
This article has been cited by other articles in PMC.
Go to:
Abstract
Recent evidence from our laboratory has demonstrated that high salt (Δ0.05 M NaCl) induced inflammatory response and cancer cell proliferation through salt inducible kinase-3 (SIK3) upregulation. As calcium influx is known to effect inflammatory response and drug resistance, we examined the impact of high salt on calcium influx in breast cancer cells. Treatment of MCF-7 and MDA-MB-231 cells with high salt induced an enhanced intracellular calcium intensity, which was significantly decreased by store operated calcium entry (SOCE) inhibitor co-treatment. Further, high salt induced P-glycoprotein (P-gp) mediated paclitaxel drug resistance in breast cancer cells. Murine tumor studies demonstrated that injection of MCF-7 cells cultured in high salt, exerted higher tumorigenicity compared to the basal cultured counterpart. Knock down of SIK3 by specific shRNA inhibited tumorigenicty, expression of SOCE regulators and P-gp activity, suggesting SIK3 is an upstream mediator of SOCE induced calcium influx. Furthermore, small molecule inhibitor, prostratin, exerted anti-tumor effect in murine models through SIK3 inhibition. Taken together, we conclude that SIK3 is an upstream regulator of store operated calcium entry proteins, Orai1 and STIM1, and mediates high salt induced inflammatory cytokine responses and P-gp mediated drug resistance. Therefore, small molecule inhibitors, such as prostratin, could offer novel anti-cancer approaches.

Keywords: breast cancer, salt, P-glycoprotein, store operated calcium entry, prostratin
Go to:
INTRODUCTION
Breast cancer is the second leading cause of cancer related mortality in American women [1]. Despite the significant improvement in both diagnostic and therapeutic modalities for the treatment of cancer patients, about 30% of patients with early-stage breast cancer succumb to recurrent disease [2]. While, systemic anti-cancer agents are effective at the beginning of therapy both in primary breast cancers and metastases, however, after a variable period of time, resistance to therapy is common mainly due to emergence of tumor variance phenotypes [3]. Although the elimination of transformed cells by host immune responses result in immune sculpting, and emergence of new treatment resistant tumor variants, the exact mechanisms and molecular factors in the tumor microenvironment mediating this cancer resistance are yet undefined [4].

Recent evidence from our laboratory has demonstrated that under high salt (50 mM above basal condition Δ0.05 M NaCl) external treatment conditions, breast cancer cells induce chronic inflammatory response with enhanced expression of inflammatory cytokines and reactive oxygen/nitrogen species (RNS/ROS) [5, 6]. Interestingly, sodium-magnetic resonance imaging (Na23-MRI) studies performed in breast cancer patients have demonstrated an increased sodium content of up to 50–70% in breast tumors as compared with surrounding soft tissue [7, 8]. These Na23-MRI studies in corroboration with our in vitro data argue for a potential effector role of salt in the tumor microenvironment towards promotion of tumor progression and probably treatment resistance in breast cancer cells.

Calcium influx mediated signaling response is well known to induce expression and secretion of inflammatory cytokines [9]. Altered expression of STIM1 and Orai1, key molecular components of store operated calcium entry (SOCE) pathways have been reported in cervical cancer [10], breast cancer [11], and esophageal cancer [12]. Further, P-glycoprotein upregulation is well known to induce treatment resistance in cancer cells. P-glycoprotein is a product of the multi drug resistance gene complex (MDR) and functions as an energy-dependent drug efflux pump and acts by active intra-cellular removal of anti-cancer drugs and there by development of treatment-resistant tumor variants [13]. In our current communication, we studied the potential role of high salt treatment towards induction of calcium influx mediated inflammatory signaling and its interplay towards induction of P-glycoprotein mediated treatment resistance.

Go to:
RESULTS
Store operated calcium channels are critical for high salt mediated inflammatory cytokine release
We have previously demonstrated that high salt treatment (Δ0.05 M NaCl) induced expression of inflammatory cytokines by breast cancer cells [5]. As the ubiquitous second messenger, Ca2+, is one of the critical regulators of inflammatory responses, we investigated the interplay of Ca2+ influx on high salt mediated cytokine release [14]. Towards this we first performed a Fluo-3 (a fluorescent Ca2+ indicator)-based Ca2+ measurement, to determine the induction of calcium influx following high salt treatment on breast cancer cell lines, MCF-7 and MDA-MB-231. As shown in Figure Figure1,1, high salt treatment induced an enhanced calcium influx peak. Normally, the cytoplasmic calcium influx peak consists of two phases, a peak phase contributed by Ca2+ release from intracellular Ca2+ stores and a plateau phase contributed by Ca2+ influx. As shown in Figure Figure1A,1A, SKF96365, an inhibitor of store operated Ca2+ entry (SOCE) [15], decreased the amplitude of the plateau phase of the high salt-induced Ca2+ response without affecting the peak phase. Similar results were observed with EGTA, which chelates extracellular Ca2+. Quantitative analysis of the fluorescence intensity changes of the plateau phase demonstrated that high salt induced a 76 ± 10% calcium influx induced Fluo-3 intensity change. Here, 0.1 M mannitol is used as a negative control for the high salt (0.05 M NaCl) treatment. NaCl being a bi-ionic species the ionic osmolar equivalent of 0.05 M NaCl is 0.1 M mannitol. As shown in Figure Figure1A,1A, treatment of cancer cells with equivalent mannitol concentration did not induce a calcium response, and thus suggesting that the calcium signal changes were a direct consequence of salt induced phenomenon and not a secondary effect as consequence of osmolar-changes induced by high salt. Interestingly, SKF96365 decreased the change (24 ± 6%, p < 0.05) in plateau phase of calcium influx, similar to the effect shown by EGTA. However, inhibitors of voltage-gated Ca2+ channels (nimodipine), NMDA receptors (2-AP), or AMPA receptors (CNQX) had minimal effect (Figure (Figure1A1A and and1B).1B). Further, ELISA based analysis of the TNF-α (Figure (Figure1C)1C) in the cell supernatant from MCF-7 cells following high salt treatment was determined to be 583 ± 109 pg/mL (p < 0.05, compared to basal normal salt treatment which is 161 ± 109 pg/mL). However, with SKF96365, a SOCE specific inhibitor treatment under high salt conditions induced inhibition of TNF-α secretion (243 ± 64 pg/mL, P < 0.05 compared to high salt treatment). Similarly, ELISA based analysis of the CXCL12 (Figure (Figure1D)1D) in the cell supernatant from MCF-7 cells following high salt treatment was determined to be 314 ± 54 pg/mL (p < 0.05, compared to basal normal salt treatment which is 73 ± 32 pg/mL). However, with SKF96365, a SOCE specific inhibitor treatment under high salt conditions induced inhibition of CXCL12 secretion (138 ± 44 pg/mL, P < 0.05 compared to high salt treatment). Collectively, the inhibition of SOCE demonstrated decreased expression of high salt-induced release of inflammatory cytokine and chemokine, TNF-α and CXCL12, respectively, in the breast cancer cells MCF-7 and MDA-MB-231 (Figure 1C, 1D). Therefore, these data suggest that high salt induces its inflammatory response through upregulation of SOCE mediated Ca2+ influx.

Figure 1
(A) Fluo-3 Ca2+ measurement indicates that SKF96365 (10 μM, inhibitor of store operated Ca2+ entry) and EGTA (2 mM) treatments decrease high salt (Δ0.05 M NaCl) induced Ca2+ influx in MCF-7 breast cancer cells. The basal (normal salt) treatment is indicated in red as control. While inhibitors of voltage-gated Ca2+ channels (nimodipine, 10 μM), NMDA receptors (2-AP, 10 μM), or AMPA receptors (CNQX, 10 μM) had no effect on high salt-induced calcium influx. (B) Quantitative changes high salt induced calcium influx measured by relative florescence shift (ΔF/F*100) in MCF-7 and MDA-MB-231 breast cancer cells following various treatment conditions. F1, plateau phase fluorescence; F0, baseline fluorescence. (C, D) Inhibition of inflammatory cytokine TNF-α (C), and inflammatory chemokine CXCL12 (D) expression MCF-7 and MDA-MB-231 breast cancer cells in following treatment with SOCE inhibitor. Data were representative of five experiments and shown as mean ± SEM, p < 0.05.

STIM1 and Orai1 are required for high salt mediated inflammatory response
Several studies from other laboratories have demonstrated that the proteins, STIM1 and Orai1, are responsible for store-operated Ca2+ entry [16]. To examine whether STIM1 and Orai1 are important molecular components involved in high salt mediated inflammatory responses, we used RNA interference (RNAi) to knock down STIM1 and Orai1 in MCF-7 and MDA-MB-231 human breast cancer cells. The successful knockdown of STIM1 or Orai1 mRNA was confirmed by western blot (Figure 2A–2C). Furthermore, the reduction of functional store-operated Ca2+ entry was verified by Fluo-3-based measurements (Figure (Figure2D).2D). Store-operated Ca2+ channels are activated when internal Ca2+ stores are empty. Thapsigargin was used to empty the intracellular Ca2+ stores in the absence of extracellular Ca2+. The Ca2+ influx was then measured by addition of 2 mM extracellular Ca2+. Both STIM1 and Orai1 siRNAs reduced the level of Ca2+ influx compared to control scramble siRNA (Figure (Figure2D).2D). Further, importantly, knock down of STIM1 and Orai1 inhibited the high salt mediated inflammatory response (Figure (Figure2E2E and and2F)2F) by MCF-7 and MDA-MB-231. Therefore, these data demonstrate that SOCE mediated Ca2+ influx is critical for the high salt induces its inflammatory response in breast cancer cells.

Open in a separate window
Figure 2
(A) Western blot analysis to demonstrate the expression of Orai1 and STIM1 followinh high salt treatment (Δ0.05 M NaCl). (B, C) Inhibition of Orai1 (B) and STIM1 (C) following high salt+specific siRNA treatment. (D) Fluo-3 Ca2+ measurement indicates that STIM1 siRNA and Orai1 siRNA decrease store-operated Ca2+ influx in MCF-7 cells. (E, F) Inhibition of inflammatory cytokine TNF-α (E), and inflammatory chemokine CXCL12 (F) expression MCF-7 and MDA-MB-231 breast cancer cells in following siRNA based knock down of Orai1 and STIM1. Data were representative of five experiments and shown as mean ± SEM, p < 0.05.

High salt induces upregulation of P-glycoprotein, a drug resistance efflux pump
Our previous studies have demonstrated that high salt treatment (Δ0.05 M NaCl) along with inflammatory stress (as noted by enhanced reactive nitrogen and oxygen species) has also induced a 24% proliferation of cancer cells compared to basal culture conditions [5]. As chronic inflammatory stress is known to result in cancer cell variants, we next performed experiments to determine if high salt also induces treatment resistance phenotype in breast cancer cells [17]. Towards this, we have passaged MCF-7 and MDA-MB-231 cells in high salt for eight passages and will be referred to as MCF-7s and 231s, respectively. As shown in Figure Figure3A3A and and3B,3B, high salt treated MCF-7s were resistant to paclitaxel induced cytotoxicity as measured by IC50 and Cmax compared to basal culture conditions. Further literature evidence suggests that the emergence of chemotherapeutic multidrug resistance (MDR) was associated with increased levels of a transmembrane glycoprotein, P-glycoprotein (P-gp). Therefore, we tested if there is change in P-gp expression following high salt treatment. As shown in Figure Figure3C,3C, high salt treatment in both MCF-7s and 231s cell lines, induced enhanced expression of chemoresistance factor, P-gp. Further, it is important to note that knock down of SOCE Ca2+ regulator molecules STIM1 and Orai1-enhanced paclitaxel sensitivity (Figure (Figure3B)3B) and reduced the expression of expression of P-gp (Figure (Figure3C).3C). This suggests that high salt mediated calcium influx regulates the development of drug resistance in salt passaged breast cancer cells. Further, to determine the functionality of the high salt mediated expression of P-gp, a membrane drug efflux channel, we performed rhodamine 123 efflux assay. The cells are pre-treated with rhodamine 123 for 1 hour, and then washed and measured for intracellular accumulation of the dye. The P-gp is a specific membrane protein which facilitates the efflux of rhodamine123, and cells with higher expression of P-gp have poor intracellular accumulation of rhodamine 123. As shown in Figure Figure3D,3D, high salt passaged cells (MCF-7s and 231s) demonstrated decreased cellular accumulation of rhodamine 123 (37 ± 8 RFU and 22 ± 7 RFU, respectively) compared to breast cancer cells cultured under basal condition (rhodamine efflux in MCF-7 and MDA-231 is normalized 100 RFU). In the presence of cyclospoin-A, a known specific P-gp inhibitor [18], and P-gp knock down there is enhanced intracellular rhodamine 123 accumulation in the high salt passaged cancer cells, thus clearly suggesting that the drug efflux functionality of P-gp is specifically upregulated in the high salt mediated drug resistance. Importantly, knock down of SOCE calcium regulators STIM1 and Orai1 (Figure (Figure3D)3D) increased intracellular rhodamine 123 accumulation and thus arguing for a critical role of SOCE mechanism in high salt mediated P-gp expression leading to drug resistance. To test for the reversible nature of the SOCE expression under normal salt (basal condition) treatment following high salt treatment (for 8 passages), we have cultured the MCF-7s cells in regular basal conditions for 5 passages (these cells will be referred as MCF-7sr cells). As shown in Figure Figure3E3E3G, reversing the salt treatment conditions to basal levels in MCF-7sr cells reversed the expression of Orai1, STIM1 and P-glycoprotein to basal levels. These data suggest that the high induced SOCE expression and P-glycoprotein mediated drug resistance is a reversible phenomenon.

Open in a separate window
Figure 3
(A) Impact of high salt treatment on paclitaxel resistance. MCF-7 cells were cultured under basal conditions; MCF-7s cells were passaged eight times in high salt added cell culture media (Δ0.05 M NaCl). (B) Pharmacokinetic parameters of paclitaxel cytotoxicity following various treatment conditions. (C) Western blot analysis of P-glycoprotein expression following high salt treatment. MCF-7s, represent MCF-7 cells were passaged eight times in high salt added cell culture media (Δ0.05 M NaCl); 231s, represents MDA-MB-231 cells passaged eight times in high salt added cell culture media (Δ0.05 M NaCl). (D) Impact of high salt treatment on intracellular Rhodamine-123 accumulation. Rhodamine 123 is pumped out of the cell during enhanced expression of P-glycoprotein. (E–G) The high salt treated cells (for 8 passages) were latter cultured in normal salt containing basal media for 5 passages (referred to as MCF-sr) and then tested for the expression of Orai1 (E), STIM1 (F) and P-glycoprotein (G). Data were representative of five experiments and shown as mean ± SEM, p < 0.05.

Enhanced tumorigenicity of high salt pre-treated breast cancer cells
To determine the effect of high salt passage on tumorigenicity of breast cancer cells we performed in vivo studies. Orthotopic tumors were induced following intramammary injection of 5 × 10⁵ cancer cells (MCF-7 or MCF-7s) in Nu/J mice. As shown in Figure Figure4A,4A, tumor volume at the end of day 39 in mice injected with high salt passaged MCF-7s cells was 498 ± 41 mm3; while tumor volume in mice injected by MCF-7 cells on day 39 was 271 ± 43 mm3 (p < 0.05). Further, mRNA based gene expression analyses (Figure (Figure4B4B4D) demonstrated an enhanced expression of SOCE regulatory molecules Orai1 and STIM1, and drug resistance protein P-gp. Using cell based phosphoproteomics approach and further functional analyses; we have previously demonstrated salt inducible kinase-3 (SIK3) mediates high salt mediated cell proliferation and inflammatory responses. In our current in vivo studies, we further confirm that in the orthotopic MCF-7s tumors there is 3.3 (p < 0.05) fold enhanced expression of SIK3 (Figure (Figure4E)4E) compared to orthotopic MCF-7 induced tumors. These data suggest that high salt pretreatment enhances the cell proliferation and tumorigenicity of breast cancer cells.

Figure 4
Tumorigenicity of MCF-7 and MCF-7s breast cancer cells
(A) Temporal changes in the tumor volume following injection of 5 × 10⁵ MCF-7 and MCF-7s cells into Nu/J (n = 6) mice. (BE) The mRNA expression of Orai (B), STIM1 (C), P-glycoprotein (D), and SIK3 (E). Data were represented as mean ± SEM, n = 6 per cohort, p < 0.05.

Decreased tumorigenicity following knock down of Orai1 in high salt pre-treated breast cancer cells
As SOCE mediated calcium influx regulator Orai1 played a critical role in high salt mediated inflammatory response and paclitaxel resistance, we next tested the impact of Orai1 knock down on the in vivo tumorigenicity of breast cancer cells. Orthotopic tumors were induced with MCF-7s control shRNA treated (MCF-7s-Cntl-shRNA) or Orai1 shRNA treated (MCF-7s-Orai1-KO) in Nu/J mice. As shown in Figure Figure5A,5A, tumor volume at the end of day 39 in mice injected with high salt passaged MCF-7s cells was 483 ± 64 mm3; while tumor volume in mice injected by Orai1-KO-MCF-7s cells on day 39 was 316 ± 72 mm3 (p < 0.05). Further, mRNA based gene expression analyses (Figure (Figure5B5B5D) demonstrated a diminished expression of SOCE regulatory molecules Orai1 and STIM1, and drug resistance protein P-gp. However, SIK3 expression (Figure (Figure5E)5E) remained unchanged with or without Orai1 knock down in MCF-7s cell induced tumors. These data indicated to us that SIK3 is upstream to SOCE regulators in high salt mediated tumorigenicity of breast cancer cells.

Figure 5
Tumorigenicity of high salt passaged breast cancer cells following shRNA knock down of Orai1 expression
(A) Temporal changes in the tumor volume following injection of 5 × 10⁵ MCF-7 and MCF-7s cells into Nu/J (n = 6) mice. (BE) The mRNA expression of Orai (B), STIM1 (C), P-glycoprotein (D) and SIK3 (E). Data were represented as mean ± SEM, n = 6 per cohort, p < 0.05.

Critical role of SIK3 in high salt mediated enhanced tumorigenicity
Previous phosphoproteomics based data from our laboratory demonstrated an enhanced expression and phosphorylation of SIK3 in breast cancer cells following high salt treatment. Further, we have shown that SIK3 mediates G0/G1-cell cycle release leading to mitotic cell division and cell proliferation [6]. Our initial studies (Figures (Figures44 and and5)5) have demonstrated an enhanced expression of SIK3 in high salt passaged MCF-7s breast cancer cells. Therefore, we tested if SIK3 plays a role in SOCE mediated calcium influx following high salt treatment. As shown in Figure 6A, 6B, thapsigargin emptied intracellular Ca2+ stores in the absence of extracellular Ca2+, followed by the Ca2+ influx measured by addition of 2 mM extracellular Ca2+ demonstrated that knock down of SIK3 reduced calcium influx and thus suggesting that SIK3 plays a direct role in calcium influx. To determine the tumorigenicity, we injected shRNA mediated SIK3 knock out MCF-7s cells into Nu/J mice. As shown in Figure Figure6C,6C, tumor volume at the end of day 39 in mice injected with high salt passaged MCF-7s cells was 478 ± 79 mm3; while tumor volume in mice injected by SIK3-KO-MCF-7s cells on day 39 was 164 ± 57 mm3 (p < 0.05). Further, mRNA based gene expression analyses (Figure 6D–6G) demonstrated a diminished expression of SIK3, SOCE regulatory molecules Orai1 and STIM1, and drug resistance protein P-gp. These data clearly demonstrated to us that SIK3 is upstream signaling molecule to SOCE regulated calcium influx in high salt mediated tumorigenicity of breast cancer cells.

Figure 6
(A) Fluo-3 Ca2+ measurement following siRNA knock down of SIK3 in MCF-7 cells. Westernblot analysis to demonstrate SIK3-siRNA knock down efficiency (H/s refers to high salt). (B) Impact of high salt treatment plus SIK3 knock down on intracellular Rhodamine-123 accumulation. (C) Tumorigenicity of high salt passaged breast cancer cells following shRNA knock down of SIK3 expression. Temporal changes in the tumor volume following injection of 5 × 10⁵ MCF-7 and MCF-7s cells into Nu/J (n = 6) mice. (D–G) The mRNA expression of Orai (D), STIM1 (E), P-glycoprotein (F) and SIK3 (G). Data were represented as mean ± SEM, n = 6 per cohort, p < 0.05.

Specific anti-tumor effect of prostratin on high salt treated breast cancer cells
We have recently demonstrated that prostratin, a small molecule identified in the tea from the bark of Somoan tree and extensively studied in HIV research, induced a cytotoxic effect specifically on high salt treated breast cancer cells potentially through SIK3 inhibition [19]. We tested if prostratin could inhibit calcium influx and the tumorigenicity of high salt passaged breast cancer cells. We have orally administered prostratin (100 μM) into Nu/J mice two weeks prior to injection of MCF-7s cells. As shown in Figure Figure7A7A and and7B,7B, thapsigargin emptied intracellular Ca2+ stores in the absence of extracellular Ca2+, followed by the Ca2+ influx measured by addition of 2 mM extracellular Ca2+ along with 8 μM prostratin demonstrated reduced calcium influx compared with vehicle control treated MCF-7 cells. Further, we orally administered prostratin (100 μM) into Nu/J mice two weeks prior to injection of MCF-7s cells. As shown in Figure Figure7C,7C, tumor volume at the end of day 39 in mice injected with vehicle treated high salt passaged MCF-7s cells was 491 ± 68 mm3; while tumor volume in mice injected by prostratin treated MCF-7s cells on day 39 was 245 ± 62 mm3 (p < 0.05). However, prostratin treatment in MCF-7 cells cultured under basal conditions did not demonstrate inhibition of tumorigenicity. Further, mRNA based gene expression analyses (Figure (Figure7D7D7G) demonstrated a diminished expression of SIK3, SOCE regulatory molecules Orai1 and STIM1, and drug resistance protein P-gp. These data clearly demonstrated to us that prostratin exerts anti-tumor effect specifically on high salt pre-treated breast cancer cells possibly through inhibition of SIK3-SOCE signaling.

Figure 7
(A) Fluo-3 Ca2+ measurement following Prostratin (8 μM) plus high salt treatment on MCF-7 cells. (B) Impact of high salt plus Prostratin (8 μM) treatment on intracellular Rhodamine-123 accumulation. (C) Tumorigenicity of high salt passaged breast cancer cells following oral administration of prostratin (100 μM). Temporal changes in the tumor volume following injection of 5 × 10⁵ MCF-7 and MCF-7s cells into Nu/J (n = 6) mice. (D–G) The mRNA expression of Orai (D), STIM1 (E), P-glycoprotein (F) and SIK3 (G). Data were represented as mean ± SEM, n = 6 per cohort, p < 0.05.

Go to:
DISCUSSION
Ca2+ is one of the most important signaling molecules known to regulate multiple cellular processes including, transcription, secretion of intracellular cytokines and cell division [20]. Multiple lines of evidence strongly suggests that cancer cells upregulate intracellular Ca2+-related signaling along with constant alterations in the expression and/or activity of calcium channels and pumps on the cell membrane [21]. Cancer cells are considered to undergo these changes to sustain their own cellular proliferation and to avoid cell death events. Human sodium-MRI evidence demonstrated high sodium concentration in breast tumors [7], although the functional significance of this high sodium in tumor microenvironment is unknown. While the exact reasons for the high sodium concentration in tumor microenvironment are unknown, previous studies from our laboratory demonstrated that high salt treatment on breast cancer cells induced inflammatory and cell proliferative responses [5, 22, 23]. As calcium signaling is one of the key mediators of these cellular responses too, in this study we evaluated if high salt treatment induces Ca2+ influx. Our current studies demonstrated that high salt treatment in breast cancer cells induced inflammatory response through SOCE regulated Ca2+ influx mediated signaling. Our current cancer cellular evidence corroborates well with evidence by Yang et al., wherein, they have shown SOCE mediated signaling is critical for the invasiveness of breast cancer cells [24]. These data suggest that SOCE regulated Ca2+ influx mediated signaling plays a critical role in multiple pro-cancer cellular processes. Further studies are needed to confirm our observations utilizing complete and conditional STIM1 and Orai1 knock out murine models. Also in it important to note that STIM1 expression is influenced by temperature changes [25]. As inflammatory responses could induced local changes in the basal cellular temperatures, future studies are needed to study the impact of temperature on high salt induced SOCE expression.

The overexpression of P-gp is one of the well-known mechanisms by which breast cancers cells develop chemo-drug resistance [26]. In this study we investigated if high salt treatment induces expression of P-gp. We demonstrated that high salt induces paclitaxel resistance through SOCE regulated Ca2+ influx mediated signaling P-gp overexpression (Figure (Figure8).8). Xie et al. have demonstrated that the expression of P-gp is also regulated by post-translational events, such as post-transcriptional glycosylation and membrane localization of P-gp [27]. Therefore, using rhodamine 123 assay we demonstrated that high salt induces stable localization of P-gp and thus possibly inhibiting paclitaxel mediated cytotoxicity on breast cancer cells. Complex functional mechanisms have been noted between the P-gp-mediated drug resistance and intracellular calcium homeostasis. Our current studies support the previous studies by Gibalova et al., where in they demonstrated that the Ca2+ influx was enhanced in cells with P-gp overexpression [28]. Further, a higher intracellular calcium concentration was noted in P-gp-positive MCF-7 breast cancer cells as compared with its P-gp-negative MCF-7 cells [29]. Taken together, our current studies support a notion that high salt in the tumor microenvironment induce P-gp mediated drug resistance in breast cancer.

Figure 8
Schematic on the mechanism by which high salt induces calcium influx and P-glycoprotein mediated drug resistance
SOCE regulate Ca2+ signaling has been implicated in various oncological processes including dysplasia, metastasis and angiogenesis [30]. SOCE is also known to induce extracellular secretion of vascular endothelial growth factor (VEGF), which increase tumor vascularity and tumor progression [31]. While SOCE in cancer cells is known to promote tumorigenicity, SOCE mediated Ca2+ signaling in known to activate cytotoxic CD8+T-lyphocytes which induce anti-tumor effect [32]. Therefore, to specifically study the tumorigenic role of high salt induced SOCE in cancer cells we performed in vivo studies in the immunodeficient Nu/J mice. Our in vivo studies demonstrated that high salt pre-treated breast cancer cells display enhanced tumorigenicity compared with breast cancer cells passaged under basal media culture conditions. These data point out an important functional role of high salt towards breast tumor progression.

Previous phosphoproteomics based studies from our laboratory demonstrated overexpression and phosphorylation of SIK3 following high salt treatment [6]. Further we reported that prostratin, a small molecule inhibitor, known to inhibit HIV reactivation in CD4+T-lymphocytes, plays an important role in SIK3inhibition [19]. In our current study, we demonstrated that prostratin was specifically effective against high salt pre-treated breast cancer cells. This supports our previous in vitro studies wherein we demonstrated that prostratin was upto 5 fold more cytotoxic on high salt pre-treated breast cancer cells.

In conclusion, we determined the molecular functionality of high salt on breast cancer cells towards induction of their tumorigenicity and drug resistance through SOCE regulated Ca2+ influx. The Orai1 and STIM1 inhibition could offer novel anti-cancer therapeutic strategies. Further, our current evidence to support the anti-tumor effect of prostratin could evoke further research to study the potential novel application of this small molecule inhibitor as an independent or add-on drug to the current breast cancer treatment regimen.

Go to:
MATERIALS AND METHODS
Cell culture
Breast cancer cells (MCF7 and MDA-MB-231) were utilized and obtained from the American Type Culture Collection (ATCC, Manassas, VA) and cultured in cell basal essential media (RPMI1640 media, Thermo Fisher Scientific, Waltham, MA) along with the media supplements such as fetal bovine serum, penicillin/streptomycin, fungizone, HEPES and glutamine, as recommended by the manufacturer and as previously described [5, 33]. Cell lines were frozen in liquid vapor nitrogen at –130° C until use. Upon thawing, cells were maintained in 5% CO2 incubator in sterile essential media at 37° C. For salt treatment conditions, cell culture media was supplemented with 0.05 M NaCl (Sigma Aldrich, St Louis, MO). We have previously performed a dose-response for salt (0–0.1 M NaCl) and found-out that 0.05 M NaCl provided highest cell proliferation [5, 23]. All chemicals unless mentioned were obtained either from Sigma Aldrich (St Louis, MO) or Thermo Fisher Scientific (Waltham, MA). The siRNA constructs against human STIM1 and Orai1 were generated using the pSUPER.retro vector according to the manufacturer's instructions (OligoEngine). The sequences used were 5′-GGCTCTGGATACAGTGCTC-3′ for STIM1 and 5′-CGTGCACAATCTCAACTCG-3′ for Orai1; 5′-GTGCAGAGTGTTGGAGTCC -3′ for SIK3. siRNA-transfected cells were selected using puromycin. For murine injections cells were transfected by the following shRNA: Orai shRNA (sc-76001-SH, Santa Cruz Biotech), and SIK3 shRNA (sc-97056-SH, Santa Cruz Biotech). Prostratin (Sigma Aldrich) treatment on cell lines was performed to determine the effect of the drug on calcium influx. All other chemical unless mentioned were obtained from Sigma Aldrich and Invitrogen.

Animal studies
All animal work was performed in accordance with protocols approved by the Institutional Animal Care and Use Committee of Vanderbilt University Medical Center. Immunodeficient Nu/J mice (Jackson labs) mice were used for studying the tumorigenicity. The MCF-7 (and high salt passaged MCF-7s) cells were trypsinized and washed with PBS before intramammary injection (5 × 10⁵ cells/mice) into mice. The tumor volume was calculated using the formula V = (W^(2) × L)/2 from caliper measurements, where V is tumor volume, W is tumor width and L is tumor length [34].

Westernblot
Total proteins were extracted from cells with lysis buffer for Western blot analysis as previously described [35, 36]. Total proteins were separated on a 4–12% sodium dodecyl sulfate-polyacrylamide gradient gel and transferred onto a nitrocellulose membrane. The membranes were blocked overnight at 4° C in Tris-buffered saline with 0.05% Tween 20 (5% nonfat milk in 10 mM Tris-HCl-100 mM NaCl-0. 1% Tween 20, pH 7.4). The membranes were incubated first with Abs specific for total and phosphorylated forms at room temperature with primary Abs diluted 1 in 1,000 in blocking buffer for 2 hrs, and then with a horseradish peroxide-conjugated secondary IgG mAb diluted 1 in 5,000 for 1hr. All primary and secondary Abs were obtained from Santa Cruz Biotech (Dallas, TX). The following specific primary antibodies to Orai1 (sc-377281), STIM1 (sc-66173), P-gp (sc-55510), GADPH (sc-47724) and Actin (sc-8432) were used. The membrane was developed using the chemiluminescence kit (Millipore) and analyzed on using Bio-Rad Universal Hood II (Hercules, CA). Morphometric analysis was done using the software provided by the company.

Quantitative real time polymerase chain reaction (qRT-PCR)
Expression profiles of genes at mRNA level in the breast cancer cell lines were analyzed using the TaqMan FAM-labeled RT-PCR primers for SIK3 (Hs00228549_m1), STIM1 (Hs00963377_m1), Orai1(Hs00385627_m1), P-gp (Hs00184500_m1), GADPH (Hs402869), and Actin (Hs4333762T), obtained from Applied Biosystems/Thermo Fisher Scientific (Grand Island, NY) as per the manufacturer's recommendation. Briefly, total RNA was extracted from 106 cells using TRIzol reagent (Sigma–Aldrich) and analyzed as mentioned previously [22, 37, 38]. RNA samples were quantified by absorbance at 260 nm. The RNA was reverse-transcribed and RT-PCR (real time PCR) was performed in a final reaction volume of 20 μL using BioRad CFX96 (Hercules, CA). Each sample was analyzed in triplicate. Cycling conditions consisted of an initial denaturation of 95° C for 15min, followed by 40 cycles of 72° C for 30 s, followed by 61° C for 1 min.

Calcium influx assay
Calcium assays were performed using Fluo-3 (Sigma Aldrich) solubilized to 10 mg/ml with dimethyl sulfoxide. Cells were loaded with 4 μg/ml Fluo-3 for 30 minutes at 37° C. Cells were washed three times in HEPES buffered saline solution (HBSS with 1 mM CaCl2, 0.5 mM MgCl2, 0.1% BSA, 10 mM HEPES) and resuspended to 1 × 10⁶ cells/ml in HEPES buffered saline solution. For measurement of store-operated Ca2+ influx, 3 mM EGTA and 2 mM thapsigargin were added to deplete internal calcium stores. Ca2+ influx was induced by subsequent addition of 2 mM Ca2+ (free) after store depletion [24, 39]. The emission wavelength set at (λem) 485 nm and capture excitation wavelength set (λex) at 520 nm. The relative fluorescence detection was performed using FilterMax F5 spectrophotometer (Molecular Devices, Sunnyvale, CA) and data obtained using instrument software.

Rhodamine 123 assay
P-gp activity was determined by measuring intracellular accumulation of rhodamine 123 [40]. The breast cancer cells under various treatment conditions. Briefly, cells were incubated at 37° C with 5.25 μM rhodamine 123 for 60 min. After washing in HBSS, cells were lysed in distilled water, and intracellular levels of rhodamine 123 were quantified by FilterMax F5 spectrophotometer (Molecular Devices, Sunnyvale, CA) and data obtained using instrument software. The emission wavelength set at (λem) 485 nm and capture excitation wavelength set (λex) at 535 nm. Data were expressed as percentage (%) of rhodamine 123 accumulation in control cells arbitrarily set at 100%.

Statistical Analysis
Data are expressed as mean ± SEM from five independent studies. Statistical differences between means were analyzed using a paired or unpaired Student's t test. A value of p less than 0.05 was considered significant. All data analysis was obtained using Origin 6 software (Origin Labs, Northampton, MA) or SPSS software, version 21 (IBM corporation, Armonk, NY).

Go to:
Footnotes
Contributed by
Author contributions

Project Conceived: VT; Designed the experiments: MI, PL, JMT and VT; Performed the experiments: DB, SA, YZ and VT. All other data was analyzed by DA, SA and VT. Wrote the paper: DA, SA and VT. All authors approved the final version of the paper.
CONFLICTS OF INTEREST

The authors have no conflicts of interest.

FUNDING

This work was supported by NIH-5U54CA163066 (VT).

Go to:
REFERENCES
1. American Cancer Society . Cancer Facts & Figures. Atlanta: American Cancer Society; 2018. 2018. [Google Scholar]
2. Siegel RL, Miller KD, Jemal A. Cancer statistics. CA Cancer J Clin. 2018;68:7–30. [PubMed] [Google Scholar]
3. Vazquez AI, Veturi Y, Behring M, Shrestha S, Kirst M, Resende MF, Jr, de Los Campos G. Increased Proportion of Variance Explained and Prediction Accuracy of Survival of Breast Cancer Patients with Use of Whole-Genome Multiomic Profiles. Genetics. 2016;203:1425–38. [PMC free article] [PubMed] [Google Scholar]
4. Mittal D, Gubin MM, Schreiber RD, Smyth MJ. New insights into cancer immunoediting and its three component phases--elimination, equilibrium and escape. Curr Opin Immunol. 2014;27:16–25. [PMC free article] [PubMed] [Google Scholar]
5. Amara S, Ivy MT, Myles EL, Tiriveedhi V. Sodium channel gammaENaC mediates IL-17 synergized high salt induced inflammatory stress in breast cancer cells. Cell Immunol. 2016;302:1–10. [PMC free article] [PubMed] [Google Scholar]
6. Amara S, Majors C, Roy B, Hill S, Rose KL, Myles EL, Tiriveedhi V. Critical role of SIK3 in mediating high salt and IL-17 synergy leading to breast cancer cell proliferation. PLoS One. 2017;12:e0180097. [PMC free article] [PubMed] [Google Scholar]
7. Ouwerkerk R, Jacobs MA, Macura KJ, Wolff AC, Stearns V, Mezban SD, Khouri NF, Bluemke DA, Bottomley PA. Elevated tissue sodium concentration in malignant breast lesions detected with non-invasive 23Na MRI. Breast Cancer Res Treat. 2007;106:151–60. [PubMed] [Google Scholar]
8. Zaric O, Pinker K, Zbyn S, Strasser B, Robinson S, Minarikova L, Gruber S, Farr A, Singer C, Helbich TH, Trattnig S, Bogner W. Quantitative Sodium MR Imaging at 7 T: Initial Results and Comparison with Diffusion-weighted Imaging in Patients with Breast Tumors. Radiology. 2016;280:39–48. [PubMed] [Google Scholar]
9. Stewart TA, Yapa KT, Monteith GR. Altered calcium signaling in cancer cells. Biochim Biophys Acta. 2015;1848:2502–11. [PubMed] [Google Scholar]
10. Chen YF, Chiu WT, Chen YT, Lin PY, Huang HJ, Chou CY, Chang HC, Tang MJ, Shen MR. Calcium store sensor stromal-interaction molecule 1-dependent signaling plays an important role in cervical cancer growth, migration, and angiogenesis. Proc Natl Acad Sci U S A. 2011;108:15225–30. [PMC free article] [PubMed] [Google Scholar]
11. McAndrew D, Grice DM, Peters AA, Davis FM, Stewart T, Rice M, Smart CE, Brown MA, Kenny PA, Roberts-Thomson SJ, Monteith GR. ORAI1-mediated calcium influx in lactation and in breast cancer. Mol Cancer Ther. 2011;10:448–60. [PubMed] [Google Scholar]
12. Umemura M, Baljinnyam E, Feske S, De Lorenzo MS, Xie LH, Feng X, Oda K, Makino A, Fujita T, Yokoyama U, Iwatsubo M, Chen S, Goydos JS, et al. Store-operated Ca2+ entry (SOCE) regulates melanoma proliferation and cell migration. PLoS One. 2014;9:e89292. [PMC free article] [PubMed] [Google Scholar]
13. Abdallah HM, Al-Abd AM, El-Dine RS, El-Halawany AM. P-glycoprotein inhibitors of natural origin as potential tumor chemo-sensitizers: A review. J Adv Res. 2015;6:45–62. [PMC free article] [PubMed] [Google Scholar]
14. Azimi I, Roberts-Thomson SJ, Monteith GR. Calcium influx pathways in breast cancer: opportunities for pharmacological intervention. Br J Pharmacol. 2014;171:945–60. [PMC free article] [PubMed] [Google Scholar]
15. Jing Z, Sui X, Yao J, Xie J, Jiang L, Zhou Y, Pan H, Han W. SKF-96365 activates cytoprotective autophagy to delay apoptosis in colorectal cancer cells through inhibition of the calcium/CaMKIIgamma/AKT-mediated pathway. Cancer Lett. 2016;372:226–38. [PMC free article] [PubMed] [Google Scholar]
16. Xia J, Wang H, Huang H, Sun L, Dong S, Huang N, Shi M, Bin J, Liao Y, Liao W. Elevated Orai1 and STIM1 expressions upregulate MACC1 expression to promote tumor cell proliferation, metabolism, migration, and invasion in human gastric cancer. Cancer Lett. 2016;381:31–40. [PubMed] [Google Scholar]
17. Vesely MD, Schreiber RD. Cancer immunoediting: antigens, mechanisms, and implications to cancer immunotherapy. Ann N Y Acad Sci. 2013;1284:1–5. [PMC free article] [PubMed] [Google Scholar]
18. Liow JS, Lu S, McCarron JA, Hong J, Musachio JL, Pike VW, Innis RB, Zoghbi SS. Effect of a P-glycoprotein inhibitor, Cyclosporin A, on the disposition in rodent brain and blood of the 5-HT1A receptor radioligand, [11C](R)-(-)-RWAY. Synapse. 2007;61:96–105. [PubMed] [Google Scholar]
19. Alotaibi D, Amara S, Johnson TL, Tiriveedhi V. Potential anticancer effect of prostratin through SIK3 inhibition. Oncol Lett. 2018;15:3252–3258. [PMC free article] [PubMed] [Google Scholar]
20. Machaca K. Ca(2+) signaling, genes and the cell cycle. Cell Calcium. 2010;48:243–50. [PMC free article] [PubMed] [Google Scholar]
21. Karlstad J, Sun Y, Singh BB. Ca(2+) signaling: an outlook on the characterization of Ca(2+) channels and their importance in cellular functions. Adv Exp Med Biol. 2012;740:143–57. [PMC free article] [PubMed] [Google Scholar]
22. Amara S, Alotaibi D, Tiriveedhi V. NFAT5/STAT3 interaction mediates synergism of high salt with IL-17 towards induction of VEGF-A expression in breast cancer cells. Oncol Lett. 2016;12:933–943. [PMC free article] [PubMed] [Google Scholar]
23. Amara S, Zheng M, Tiriveedhi V. Oleanolic Acid Inhibits High Salt-Induced Exaggeration of Warburg-like Metabolism in Breast Cancer Cells. Cell Biochem Biophys. 2016;74:427–34. [PMC free article] [PubMed] [Google Scholar]
24. Yang S, Zhang JJ, Huang XY. Orai1 and STIM1 are critical for breast tumor cell migration and metastasis. Cancer Cell. 2009;15:124–34. [PubMed] [Google Scholar]
25. Xiao B, Coste B, Mathur J, Patapoutian A. Temperature-dependent STIM1 activation induces Ca(2)+ influx and modulates gene expression. Nat Chem Biol. 2011;7:351–8. [PMC free article] [PubMed] [Google Scholar]
26. Callaghan R, Luk F, Bebawy M. Inhibition of the multidrug resistance P-glycoprotein: time for a change of strategy? Drug Metab Dispos. 2014;42:623–31. [PMC free article] [PubMed] [Google Scholar]
27. Xie Y, Burcu M, Linn DE, Qiu Y, Baer MR. Pim-1 kinase protects P-glycoprotein from degradation and enables its glycosylation and cell surface expression. Mol Pharmacol. 2010;78:310–8. [PubMed] [Google Scholar]
28. Sulova Z, Seres M, Barancik M, Gibalova L, Uhrik B, Polekova L, Breier A. Does any relationship exist between P-glycoprotein-mediated multidrug resistance and intracellular calcium homeostasis. Gen Physiol Biophys. 2009;28:F89–95. [PubMed] [Google Scholar]
29. Bao L, Hazari S, Mehra S, Kaushal D, Moroz K, Dash S. Increased expression of P-glycoprotein and doxorubicin chemoresistance of metastatic breast cancer is regulated by miR-298. Am J Pathol. 2012;180:2490–503. [PMC free article] [PubMed] [Google Scholar]
30. Xie J, Pan H, Yao J, Zhou Y, Han W. SOCE and cancer: Recent progress and new perspectives. Int J Cancer. 2016;138:2067–77. [PMC free article] [PubMed] [Google Scholar]
31. Bergmeier W, Weidinger C, Zee I, Feske S. Emerging roles of store-operated Ca(2)(+) entry through STIM and ORAI proteins in immunity, hemostasis and cancer. Channels (Austin) 2013;7:379–91. [PMC free article] [PubMed] [Google Scholar]
32. Shaw PJ, Feske S. Regulation of lymphocyte function by ORAI and STIM proteins in infection and autoimmunity. J Physiol. 2012;590:4157–67. [PMC free article] [PubMed] [Google Scholar]
33. Tiriveedhi V, Gelman AE, Mohanakumar T. HIF-1alpha signaling by airway epithelial cell K-alpha1-tubulin: role in fibrosis and chronic rejection of human lung allografts. Cell Immunol. 2012;273:59–66. [PMC free article] [PubMed] [Google Scholar]
34. Faustino-Rocha A, Oliveira PA, Pinho-Oliveira J, Teixeira-Guedes C, Soares-Maia R, da Costa RG, Colaco B, Pires MJ, Colaco J, Ferreira R, Ginja M. Estimation of rat mammary tumor volume using caliper and ultrasonography measurements. Lab Anim (NY) 2013;42:217–24. [PubMed] [Google Scholar]
35. Tiriveedhi V, Tucker N, Herndon J, Li L, Sturmoski M, Ellis M, Ma C, Naughton M, Lockhart AC, Gao F, Fleming T, Goedegebuure P, Mohanakumar T, et al. Safety and preliminary evidence of biologic efficacy of a mammaglobin-a DNA vaccine in patients with stable metastatic breast cancer. Clin Cancer Res. 2014;20:5964–75. [PMC free article] [PubMed] [Google Scholar]
36. Tiriveedhi V, Angaswamy N, Brand D, Weber J, Gelman AG, Hachem R, Trulock EP, Meyers B, Patterson G, Mohanakumar T. A shift in the collagen V antigenic epitope leads to T helper phenotype switch and immune response to self-antigen leading to chronic lung allograft rejection. Clin Exp Immunol. 2012;167:158–68. [PMC free article] [PubMed] [Google Scholar]
37. Tiriveedhi V, Takenaka M, Ramachandran S, Gelman AE, Subramanian V, Patterson GA, Mohanakumar T. T regulatory cells play a significant role in modulating MHC class I antibody-induced obliterative airway disease. Am J Transplant. 2012;12:2663–74. [PMC free article] [PubMed] [Google Scholar]
38. Tiriveedhi V, Takenaka M, Sarma NJ, Gelman AG, Mohanakumar T. Anti-major histocompatibility complex-induced obliterative airway disease: selective role for CD4 and CD8 T cells in inducing immune responses to self-antigens. J Heart Lung Transplant. 2013;32:714–22. [PMC free article] [PubMed] [Google Scholar]
39. Honorio-Franca AC, Nunes GT, Fagundes DL, de Marchi PG, Fernandes RT, Franca JL, Franca-Botelho Ado C, Moraes LC, Varotti Fde P, Franca EL. Intracellular calcium is a target of modulation of apoptosis in MCF-7 cells in the presence of IgA adsorbed to polyethylene glycol. Onco Targets Ther. 2016;9:617–26. [PMC free article] [PubMed] [Google Scholar]
40. Jouan E, Le Vee M, Mayati A, Denizot C, Parmentier Y, Fardel O. Evaluation of P-Glycoprotein Inhibitory Potential Using a Rhodamine 123 Accumulation Assay. Pharmaceutics. 2016;8:1–13. [PMC free article] [PubMed] [Google Scholar]
 
Last edited:
OP
Tristan Loscha
Joined
Dec 18, 2018
Messages
2,206
Sodium Handling and Interaction in Numerous Organs
Shintaro Minegishi, Friedrich C Luft, Jens Titze, Kento Kitada
American Journal of Hypertension, hpaa049, Sodium Handling and Interaction in Numerous Organs
Published:
21 March 2020
Article history

Abstract
Salt (NaCl) is a prerequisite for life. Excessive intake of salt, however, is said to increase disease risk including hypertension, arteriosclerosis, heart failure, renal disease, stroke, and cancer. Therefore, considerable research has been expended on the mechanism of sodium handling based on the current concepts of sodium balance. The studies have necessarily relied on relatively short-term experiments and focused on extremes of salt intake in humans. Ultra-long-term salt balance has received far less attention. We performed long-term salt balance studies at intakes of 6, 9, and 12 g/day and found that although the kidney remains the long-term excretory gate, tissue and plasma sodium concentrations are not necessarily the same and that urinary salt excretion does not necessarily reflect total-body salt content. We found that to excrete salt, the body makes a great effort to conserve water, resulting in a natriuretic-ureotelic principle of salt excretion. Of note, renal sodium handling is characterized by osmolyte excretion with anti-parallel water reabsorption, a state-of-affairs that is achieved through the interaction of multiple organs. In this review, we discuss novel sodium and water balance concepts in reference to our ultra-long-term study. An important key to understanding body sodium metabolism is to focus on water conservation, a biological principle to protect from dehydration, since excess dietary salt excretion into the urine predisposes to renal water loss because of natriuresis. We believe that our research direction is relevant not only to salt balance but also to cardiovascular regulatory mechanisms.


Sodium Handling and Interaction in Numerous Organs
 

Attachments

zarrin77

Member
Joined
May 12, 2015
Messages
173
Location
San Diego, CA
@zarrin77 u have any take on this? I havent read up on salt as much as u have

These are my thoughts:

Purified salt is known to increase inflammation. Yet, sodium bicarbonate seems to decrease inflammation in at least some ways:
Oral NaHCO3 Activates a Splenic Anti-Inflammatory Pathway: Evidence That Cholinergic Signals Are Transmitted via Mesothelial Cells. - PubMed - NCBI
good write up: April 2018 - SuppVersity: Nutrition and Exercise Science for Everyone

Also, purified salt (which they used for all these studies above) acts very differently than unrefined salt:
Natural sea salt consumption confers protection against hypertension and kidney damage in Dahl salt-sensitive rats

While the other minerals in the unrefined salt probably makes the difference, the *mechanism* of the difference might be the fact that purified salt has a lower pH and increases total body acidity, which might not occur with unrefined salt (unrefined salt can even be alkaline):
pH of drinking water influences the composition of gut microbiome and type 1 diabetes incidence. - PubMed - NCBI
Low-grade metabolic acidosis may be the cause of sodium chloride-induced exaggerated bone resorption. - PubMed - NCBI
Dietary sodium chloride intake independently predicts the degree of hyperchloremic metabolic acidosis in healthy humans consuming a net acid-produc... - PubMed - NCBI
https://journals.physiology.org/doi/abs/10.1152/ajplegacy.1967.212.1.54

In general, that one rat study above is the best evidence we have thus far that refined salt acts completely differently from unrefined salt.

If you are worried about your particular situation, I would recommend using baking soda water as a sodium alternative. It may be healthier in general anyway.

Lastly, there are a plethora of studies showing that increases in potassium can pretty much negate the negative effects of excess refined salt on the cardiovascular system, and one of the main ways it does this is through blocking ROS production via downregulating NADPH oxidase (which excess refined salt upregulates.)

I have seen many issues with people consuming too little salt as well, especially with athletes. There are documented negative effects from salt restriction, such as increases in triglycerides, catecholamines, insulin resistance, lipoproteins, and possibly anxiety:
Metabolic effects of strict salt restriction in essential hypertensive patients. - PubMed - NCBI
Dietary Salt (Sodium Chloride) Requirement and Adverse Effects of Salt Restriction in Humans. - PubMed - NCBI
Conflicting Evidence on Health Effects Associated with Salt Reduction Calls for a Redesign of the Salt Dietary Guidelines. - PubMed - NCBI
https://www.ncbi.nlm.nih.gov/pubmed/24054177

Keep in mind, almost ALL human trials (except for maybe the really old ones) use refined salt. So when people are “lowering their salt intake”, the primarily comes from lowering refined salt intake. IMO we need a lot more research done on the possible differences between refined and unrefined salt. (This makes sense too, as the response to inflammation that your body gets from orange juice vs isocaloric refined sugar water are completely different, due to the micro-components in the orange juice:
https://academic.oup.com/ajcn/article/91/4/940/4597353
 

Cloudhands

Member
Joined
Jan 11, 2019
Messages
988
These are my thoughts:

Purified salt is known to increase inflammation. Yet, sodium bicarbonate seems to decrease inflammation in at least some ways:
Oral NaHCO3 Activates a Splenic Anti-Inflammatory Pathway: Evidence That Cholinergic Signals Are Transmitted via Mesothelial Cells. - PubMed - NCBI
good write up: April 2018 - SuppVersity: Nutrition and Exercise Science for Everyone

Also, purified salt (which they used for all these studies above) acts very differently than unrefined salt:
Natural sea salt consumption confers protection against hypertension and kidney damage in Dahl salt-sensitive rats

While the other minerals in the unrefined salt probably makes the difference, the *mechanism* of the difference might be the fact that purified salt has a lower pH and increases total body acidity, which might not occur with unrefined salt (unrefined salt can even be alkaline):
pH of drinking water influences the composition of gut microbiome and type 1 diabetes incidence. - PubMed - NCBI
Low-grade metabolic acidosis may be the cause of sodium chloride-induced exaggerated bone resorption. - PubMed - NCBI
Dietary sodium chloride intake independently predicts the degree of hyperchloremic metabolic acidosis in healthy humans consuming a net acid-produc... - PubMed - NCBI
https://journals.physiology.org/doi/abs/10.1152/ajplegacy.1967.212.1.54

In general, that one rat study above is the best evidence we have thus far that refined salt acts completely differently from unrefined salt.

If you are worried about your particular situation, I would recommend using baking soda water as a sodium alternative. It may be healthier in general anyway.

Lastly, there are a plethora of studies showing that increases in potassium can pretty much negate the negative effects of excess refined salt on the cardiovascular system, and one of the main ways it does this is through blocking ROS production via downregulating NADPH oxidase (which excess refined salt upregulates.)

I have seen many issues with people consuming too little salt as well, especially with athletes. There are documented negative effects from salt restriction, such as increases in triglycerides, catecholamines, insulin resistance, lipoproteins, and possibly anxiety:
Metabolic effects of strict salt restriction in essential hypertensive patients. - PubMed - NCBI
Dietary Salt (Sodium Chloride) Requirement and Adverse Effects of Salt Restriction in Humans. - PubMed - NCBI
Conflicting Evidence on Health Effects Associated with Salt Reduction Calls for a Redesign of the Salt Dietary Guidelines. - PubMed - NCBI
Dietary sodium restriction: take it with a grain of salt. - PubMed - NCBI

Keep in mind, almost ALL human trials (except for maybe the really old ones) use refined salt. So when people are “lowering their salt intake”, the primarily comes from lowering refined salt intake. IMO we need a lot more research done on the possible differences between refined and unrefined salt. (This makes sense too, as the response to inflammation that your body gets from orange juice vs isocaloric refined sugar water are completely different, due to the micro-components in the orange juice:
Orange juice neutralizes the proinflammatory effect of a high-fat, high-carbohydrate meal and prevents endotoxin increase and Toll-like receptor expression
knew youd show up with a good response, thanks brudda
 
OP
Tristan Loscha
Joined
Dec 18, 2018
Messages
2,206
Tissue sodium content in patients with systemic lupus erythematosus: association with disease activity and markers of inflammation
D A Carranza-León 1 , A Oeser 1 , A Marton 2 , P Wang 3 , J C Gore 3 , J Titze 2 , C M Stein 1 4 , C P Chung 1 5 , M J Ormseth 1 5
Affiliations

Abstract
Objectives: Sodium (Na+) is stored in the skin and muscle and plays an important role in immune regulation. In animal models, increased tissue Na+ is associated with activation of the immune system, and high salt intake exacerbates autoimmune disease and worsens hypertension. However, there is no information about tissue Na+ and human autoimmune disease. We hypothesized that muscle and skin Na+ content is (a) higher in patients with systemic lupus erythematosus (SLE) than in control subjects, and (b) associated with blood pressure, disease activity, and inflammation markers (interleukin (IL)-6, IL-10 and IL-17 A) in SLE.

Methods: Lower-leg skin and muscle Na+ content was measured in 23 patients with SLE and in 28 control subjects using 23Na+ magnetic resonance imaging. Demographic and clinical information was collected from interviews and chart review, and blood pressure was measured. Disease activity was assessed using the SLE Disease Activity Index (SLEDAI). Plasma inflammation markers were measured by multiplex immunoassay.

Results: Muscle Na+ content was higher in patients with SLE (18.8 (16.7-18.3) mmol/L) than in control subjects (15.8 (14.7-18.3) mmol/L; p < 0.001). Skin Na+ content was also higher in SLE patients than in controls, but this difference was not statistically significant. Among patients with SLE, muscle Na+ was associated with SLEDAI and higher concentrations of IL-10 after adjusting for age, race, and sex. Skin Na+ was significantly associated with systolic blood pressure, but this was attenuated after covariate adjustment.

Conclusion: Patients with SLE had higher muscle Na+ content than control subjects. In patients with SLE, higher muscle Na+ content was associated with higher disease activity and IL-10 concentrations.

Keywords: Lupus; inflammation; magnetic resonance image; sodium.
 
OP
Tristan Loscha
Joined
Dec 18, 2018
Messages
2,206
logo-jciinsight.gif

JCI Insight. 2019 Dec 5; 4(23): e127868.
Published online 2019 Dec 5. doi: 10.1172/jci.insight.127868
PMCID: PMC6962031
PMID: 31801906
Osteoprotective action of low-salt diet requires myeloid cell–derived NFAT5
Agnes Schröder,
corrauth.gif
1 Patrick Neubert,2 Jens Titze,3 Aline Bozec,4 Wolfgang Neuhofer,5 Peter Proff,1 Christian Kirschneck,1 and Jonathan Jantsch2
Author information Article notes Copyright and License information Disclaimer
Associated Data
Supplementary Materials
Go to:

Abstract
Dietary salt consumption leads to cutaneous Na+ storage and is associated with various disorders, including osteopenia. Here, we explore the impact of Na+ and the osmoprotective transcription factor nuclear factor of activated T cell 5 (NFAT5) on bone density and osteoclastogenesis. Compared with treatment of mice with high-salt diet, low-salt diet (LSD) increased bone density, decreased osteoclast numbers, and elevated Na+ content and Nfat5 levels in the BM. This response to LSD was dependent on NFAT5 expressed in myeloid cells. Simulating in vivo findings, we exposed osteoclast precursors and osteoblasts to elevated Na+ content (high-salt conditions; HS¢), resulting in increased NFAT5 binding to the promotor region of RANKL decoy receptor osteoprotegerin (OPG). These data not only demonstrate that NFAT5 in myeloid cells determines the Na+ content in BM, but that NFAT5 is able to govern the expression of the osteoprotective gene OPG. This provides insights into mechanisms of Na+-induced cessation of osteoclastogenesis and offers potentially new targets for treating salt-induced osteopenia.

Keywords: Bone Biology
Keywords: Bone development, Bone marrow
Go to:
Abstract


Go to:
Introduction
Bones are essential for moving, protecting organs, supporting hematopoiesis, sustaining brain and lung function, and storing minerals. Bone is a vascularized, living, ever-changing, mineralized connective tissue. To ensure bone stability and integrity, about 10% of the bone material is renewed every year (13). Bone remodeling is a complex process characterized by the interaction of bone-forming osteoblasts and bone-resorbing osteoclasts (1, 4). During physiological bone remodeling, bone formation and resorption are strictly coupled to avoid any change in bone quality or mass. Many pathological conditions, like osteoporosis, are associated with enhanced bone resorption compared with formation (5, 6). While osteoblasts are derived from mesenchymal stem cells (7), bone osteoclasts differentiate from hematopoietic stem cells (8) induced by the 2 essential factors macrophage CSF (M-CSF) and RANKL (8). RANKL acts as the primary factor that promotes the differentiation of osteoclasts precursor cells to active, bone-resorbing osteoclasts (9, 10). The activity of RANKL is controlled by its decoy receptor osteoprotegerin (OPG) (1113). The interaction of RANKL and OPG is essential for the control of osteoclastogenesis (1416).

Contemporary Western diets contain a superfluous amount of Na+ (1719). Excessive dietary Na+ intake is, for example, linked with hypertension (19, 20) and osteopenia (21). Dietary increases in Na+ consumption induce various physiological responses (22). These include cutaneous Na+ storage and induction of a macrophage-driven cutaneous response, which facilitates Na+ mobilization from the skin to avoid excess increases in blood pressure (2325). This critically involves the activity of the osmoprotective transcription factor nuclear factor of activated T cell 5 (NFAT5, also known as tonicity-dependent enhancer binding protein [TonEBP]), which can be induced by osmotic stress in a calcineurin-independent manner (2628)

Surprisingly, both hyponatremia and Na+-rich diets are linked to osteopenia (21, 2937). Osteoclasts, which are derived from mononuclear phagocytes, play a major role in bone resorption and remodeling (1, 2). Previous studies demonstrate that Na+ availability influences osteoclastogenesis (38, 39). The impact of Na+-rich diets on BM Na+ content and the role of NFAT5-driven osmoprotective responses in osteoclastogenesis is, however, unexplored.

Go to:
Results
Myeloid cell–derived NFAT5 prevents bone loss upon a low-salt diet.
We fed myeloid cell–specific conditional Nfat5-KO mice (Nfat5Δmyel) and control mice either a low-salt diet (LSD) or a high salt diet (HSD) for 2 weeks. Control mice kept under LSD displayed increased bone volume/total volume ratio (BV/TV) compared with HSD-treated control mice, indicating enhanced bone density (Figure 1, A and B). Surprisingly, Nfat5Δmyel mice did not display an increased BV/TV ratio after LSD treatment (Figure 1, A and B). We detected no changes in osteoblast numbers neither in control nor in Nfat5Δmyel mice (Figure 1C), while the number of osteoclasts was reduced in control mice kept on LSD (Figure 1D). In contrast, osteoclast numbers did not change in Nfat5Δmyel mice upon LSD (Figure 1D). In line with that, we detected decreased serum levels of TRACP-5b (Figure 1E) and β-CrossLaps (β-CTx) (Supplemental Figure 1; supplemental material available online with this article; JCI Insight - Osteoprotective action of low-salt diet requires myeloid cell–derived NFAT5) in control, but not in Nfat5Δmyel mice, with LSD. The RANKL-OPG axis plays a key role in osteoclastogenesis and bone density (16, 40). LSD did not affect RANKL expression in the BM of control and Nfat5Δmyel mice (Figure 1F). In contrast, LSD increased the expression of the RANKL decoy receptor Opg mRNA only in control mice (Figure 1G). As reported earlier (23), we noted an increased cutaneous Na+ accumulation upon HSD (Supplemental Figure 2). In order to obtain BM, we flushed the femora of mice with distilled water. Detailed assessment of electrolyte content in BM, however, revealed no changes in Cl– or K+ content in BM of control and Nfat5Δmyel mice (Supplemental Figure 3, A and B). In contrast, LSD enhanced Na+ content (Figure 1H) and osmolality (Supplemental Figure 3C) in the BM homogenate of control mice but not in Nfat5Δmyel mice. In line with these results, we detected an enhanced expression of the osmoprotective transcription factor Nfat5 only in control mice exposed to a LSD (Figure 1I). From these findings, we conclude that (A) HSD does not uniformly result in Na+ accumulation in all organs, (b) myeloid cell–derived NFAT5 is important for Na+ accumulation in BM, and (c) myeloid cell–derived NFAT5 is required for increased bone density and low osteoclast numbers in animals fed LSD.

Open in a separate window
Figure 1
Myeloid cell–derived NFAT5 prevents bone loss upon a low-salt diet.
(A) Representative pictures of μCT analysis of HSD- and LSD-fed mice. Analyzed region of interest is colored in red. (B) Analysis of bone to total volume ratio (BV/TV). (C and D) Osteoblast (C) and osteoclast (D) numbers per bone perimeter (B. Pm). (E) TRACP-5b levels in serum. (F and G) Rankl (F) and Opg (G) gene expression in BM. (H and I) Na+ content (H) and Nfat5 (I) mRNA expression in BM. n = 6 for each group. *P ≤ 0.05, **P ≤ 0.01, ***P ≤ 0.001. Unpaired, 2-tailed Student’s t tests.

Increased osmolality due to high-salt conditions (HS¢) fully incapacitates osteoclastogenesis.
To further assess the role of increased osmolality and Na+ content on osteoclastogenesis, we exposed RANKL/M-CSF–treated WT RAW264.7 cells to either an increase of 40 mM NaCl (HS¢) or 80 mM mannitol. In contrast to NaCl, mannitol represents a nonionic osmolyte that is known to increase tonicity but does not penetrate the cell membrane (41, 42). Exposure to HS¢ or mannitol increased Nfat5 levels in RANKL/M-CSF–treated WT RAW264.7 cells (Figure 2A) and BM-derived macrophages (Supplemental Figure 4). Of note, LDH assays indicated that increases in Na+ are not cytotoxic (Supplemental Figure 5). HS¢ blunted the expression of various osteoclast-specific genes, such as acid phosphatase 5 (Acp5), cathepsin K (Ctsk), matrix metalloproteinase 9 (Mmp9), and osteoclast-associated immunoglobulin-like receptor (Oscar) (Figure 2B). Mannitol, in contrast, only affected Mmp9 gene expression significantly (Figure 2B). However, increases of osmolality by both addition of Na+ or mannitol reduced TRAP staining (Figure 2C). Nonetheless, calcium phosphate (CaP) resorption was only significantly impaired by HS¢ (Figure 2D). These data demonstrate that, although exposure to mannitol is able to blunt osteoclastogenesis, only increases in osmolality with Na+ fully incapacitate osteoclastogenesis.

Figure 2
Increased osmolality due to high salt (HS¢) fully incapacitates osteoclastogenesis.
(A) Nfat5 mRNA expression. Representative NFAT5 immunoblot. (B) Expression of osteoclast-specific genes. (C) Representative TRAP staining and TRAP assay of cell culture supernatants. (D) Representative images of CaP resorption assay. Resorbed CaP areas appear as black gaps. Quantification of CaP resorption assay using ImageJ. n = 6 for each group. *P ≤ 0.05, **P ≤ 0.01, ***P ≤ 0.001. Welch-corrected ANOVA with Games-Howell post hoc tests. Scale bar: 100 µm.

Nfat5 overexpression prevented osteoclastogenesis of RANKL/M-CSF–treated RAW264.7 cells.
To further assess the role of NFAT5 in this state of affairs, we tested whether constitutive overexpression of Nfat5 in RAW264.7 cells (Nfat5-over) under normal salt conditions (NS¢) (Figure 3A) is sufficient to disturb osteoclast differentiation. We found that Nfat5 overexpression abolished the expression of osteoclast-specific genes (Figure 3B) and impaired TRAP staining (Figure 3C) and CaP resorption (Figure 3D) upon exposure to RANKL/M-CSF. Moreover, HS¢ did not further impair osteoclastogenesis in Nfat5-over cells (Figure 3, B–D). These data indicate that Nfat5 overexpression is sufficient to impair RANKL/M-CSF–driven osteoclastogenesis.

Figure 3
Nfat5 overexpression prevented osteoclastogenesis of RANKL/M-CSF–treated RAW264.7 cells.
(A) Nfat5 mRNA expression in RAW264.7 cells without (Nfat5-WT) or with Nfat5 overexpression (Nfat5-over, n = 6). Representative NFAT5 immunoblot. (B) Expression of osteoclast-specific genes in Nfat5-WT or Nfat5-over cells (n = 6). (C) Representative TRAP staining (red) of Nfat5-WT or Nfat5-over cells and TRAP assay of the supernatants (n = 9). (D) Representative images of CaP resorption assay. Resorbed CaP areas appear as black gaps. Quantification of CaP resorption assay using ImageJ (n = 9). AU, arbitrary units. *P ≤ 0.05, **P ≤ 0.01, ***P ≤ 0.001. Welch-corrected ANOVA with Games-Howell post hoc tests. Scale bar: 100 µm.

Nfat5 siRNA treatment restored osteoclastogenesis of RANKL/M-CSF–treated RAW264.7 cells under HS¢.
To test the contribution of Nfat5 in HS¢, we silenced Nfat5 expression in RAW264.7 cells (Figure 4A). This alleviated the HS-induced blockade of osteoclast-specific gene expression (Figure 4B). Furthermore, in Nfat5-silenced cells, the suppressive action of HS¢ on TRAP staining was largely abolished (Figure 4C). Moreover, Nfat5-deficient cells displayed higher CaP resorption than control cells upon incubation in HS¢ (Figure 4D). Nevertheless, even in the absence of Nfat5 in macrophages, HS¢ exerted substantial impairment on CaP resorption. Of note, Nfat5 siRNA transfection tended to increase the TRAP level under NS¢ (Figure 4D). More importantly, Nfat5 deficiency was accompanied by significantly enhanced CaP resorption, even in NS¢ in vitro (Figure 4D). These data demonstrate that NFAT5 is critically involved in impaired osteoclastogenesis under HS¢.

Figure 4
Nfat5 siRNA treatment restored osteoclastogenesis of RANKL/M-CSF–treated RAW264.7 cells under HS¢.
(A) Nfat5 mRNA expression in RAW264.7 cells treated with ns-siRNA or Nfat5 siRNA. Representative NFAT5 immunoblot of ns-siRNA– or Nfat5 siRNA–treated samples. (B) Expression of osteoclast-specific genes in ns-siRNA– or Nfat5 siRNA–treated RAW264.7 cells. (C) Representative TRAP staining of ns-siRNA– or Nfat5 siRNA–treated RAW264.7 cells and TRAP assay of the supernatants. (D) Representative pictures of CaP resorption assay. Resorbed CaP areas appear as black gaps. Quantification of CaP resorption assay using ImageJ. n = 6 for each group. AU, arbitrary units. *P ≤ 0.05, **P ≤ 0.01, ***P ≤ 0.001. Welch-corrected ANOVA with Games-Howell post hoc tests. Scale bar: 100 µm.

NFAT5 governs OPG expression under HS¢ in RANKL/M-CSF–treated RAW264.7 cells.
Since diet-dependent Opg expression in BM hinged on Nfat5 expression in myeloid cells (Figure 1G), we quantified OPG levels in cell culture supernatants. HS¢ boosted OPG gene and protein expression in RANKL/M-CSF–treated RAW264.7 cells (Figure 5A). Likewise, Nfat5 overexpression enhanced OPG expression on mRNA and protein level in both NS¢ and HS¢ (Figure 5A), and Nfat5 silencing truncated HS¢-induced OPG on mRNA and protein level (Figure 5B). The Opg promotor region contains 3 putative NFAT5 binding sites (Supplemental Figure 6). ChIP analysis revealed binding of NFAT5 to these promoter regions upon exposure to HS¢ in RANKL/M-CSF–treated RAW264.7 cells (Figure 5C). These findings establish that OPG is an NFAT5 target gene in these cells.

Open in a separate window
Figure 5
NFAT5 governs OPG expression under HS¢ in RANKL/M-CSF–treated RAW264.7 cells.
(A) OPG mRNA (n = 6) and protein secretion (n = 8) in Nfat5-WT or Nfat5-overexpressing RAW264.7 cells (Nfat5-over). (B) OPG mRNA and protein expression in ns-siRNA– or Nfat5 siRNA–treated RAW264.7 cells (n = 6). (C) ChIP analysis of interaction between NFAT5 and Opg promotor in RAW264.7 cells under NS¢ or HS¢ (n = 4). AU, arbitrary units. *P ≤ 0.05, **P ≤ 0.01, ***P ≤ 0.001. Welch-corrected ANOVA with Games-Howell post hoc tests, except C (unpaired, 2-tailed Student’s t test).

NFAT5 regulates OPG expression under HS¢ in murine osteoblasts.
Since osteoblasts are the main source of OPG, we also tested the impact of NFAT5. As we found in RANKL/M-CSF–treated RAW264.7 cells, murine osteoblasts subjected to HS¢ increased NFAT5 and OPG expression (Figure 6, A and B). Again, silencing of NFAT5 was associated with reduced OPG expression in osteoblasts exposed to HS¢ (Figure 6, A and B). ChIP analysis revealed that NFAT5 is able to bind to the OPG promoter upon exposure to HS¢ in osteoblasts, as well (Figure 6C). From these findings, we conclude that NFAT5 governs HS¢-triggered OPG expression in osteoblasts.

Open in a separate window
Figure 6
NFAT5 regulates OPG expression under HS¢ in murine osteoblasts.
NFAT5 influences OPG expression under high-salt conditions (HS¢) in murine osteoblasts. (A) NFAT5 mRNA and protein expression in ns-siRNA– or Nfat5 siRNA–treated osteoblasts under NS¢ or HS¢ (n = 6). Representative NFAT5 immunoblot of ns-siRNA– or Nfat5 siRNA–treated samples under NS¢ or HS¢. (B) OPG mRNA and protein expression in ns-siRNA– or Nfat5 siRNA–treated osteoblasts under NS¢ or HS¢ (n = 6 per group). (C) ChIP analysis of interaction between NFAT5 and Opg promotor in osteoblasts under NS¢ or HS¢ (n = 4). AU, arbitrary units. *P ≤ 0.05, **P ≤ 0.01, ***P ≤ 0.001. Welch-corrected ANOVA with Games-Howell post hoc tests, except C (unpaired, 2-tailed Student’s t test).

Go to:
Discussion
In accordance with earlier studies, we show that disturbances in the Na+ balance are linked with osteopenia and reduced bone density in various studies (21, 3032, 37).

In line with previous studies, we found that HSD resulted in enhanced skin Na+ content (24, 25). Surprisingly, we found that LSD resulted in increased Na+ content in the BM. Of note, this response is confined to the BM, while total bone Na+ content remained unaffected, as demonstrated earlier (43). Our findings substantiate the notion that Na+ contents are not evenly distributed in the body and may vary locally, depending on dietary and other environmental challenges such as inflammation or infection (2325, 4446). In line with this idea, recent studies demonstrate that HSD not only induces Na+ storage in the skin, but results in a complete reorganization of body metabolism (18, 44).

Expression of the osmoprotective transcription NFAT5 in myeloid cells regulates local electrolyte content in the skin (23, 24). Here, we demonstrate that expression of this transcription factor in myeloid cells is required for Na+ accumulation in the BM. How LSD triggers increased Nfat5 expression in the BM is unclear. Moreover, the mechanism employed by NFAT5 in myeloid cells to increase the Na+ content in the BM upon LSD remains elusive. Both issues warrant further exploration. It is tempting to speculate that the renin/angiotensin/aldosterone axis might be involved, as well (47, 48).

Local Na+ contents are known to impact homeostatic and inflammatory innate myeloid cell function (24, 49). For instance, exposure of macrophages to HS¢ impaired the regulatory, antiinflammatory activity of macrophages (41), while increases in local Na+ enhanced their antimicrobial activity. Increases in Na+ have been demonstrated to help fight against the protozoan parasite Leishmania major (45) and against the bacterial pathogen E. coli (42, 50). Recent evidence also suggests that elevation in Na+ facilitates antiviral responses against vesicle stomatitis virus (51). In this report, we focused on the impact of this Na+ microenvironment on the cessation of osteoclastogenesis. It is conceivable that Na+ directly influences bone resorbing activity of fully differentiated osteoclasts, in addition, since Na+/H+ exchanger activity (5255), Na+/Ca2+ exchanger activity (5658), and Na+-dependent phosphate transport (59) are involved in the functionality of the resorptive hemivacuole. In addition, local Na+ content might affect the activity of the Na+/K+-ATPase (60, 61), which is required for secondary ion transport, for example by the Na+/Ca2+ and Na+/H+ exchangers.

Here, we observed that increases in local Na+ by 40 mM truncated osteoclast differentiation. This is in line with Wu et al., who found that excesses of 50 mM Na+ inhibited osteoclastogenesis of murine osteoclast progenitor cells (38). In contrast, when less than 50 mM of Na+ was added, Wu et al. noted enhanced osteoclastogenesis (38). Moreover, low Na+ content reportedly promote osteoclastogenesis (39). Therefore, it is conceivable that low Na+ content is able to facilitate osteoclastogenesis, whereas high Na+ content impairs osteoclastogenesis. The mechanisms linked to enhanced osteoclastogenesis upon low Na+ exposure remain, however, unknown.

We found that increases of Na+ by 40 mM were paralleled by increased expression of the RANKL decoy receptor (2, 62) OPG in osteoclast-precursor cells and osteoblasts upon exposure of cells to HS¢. With increased Na+ content, the osmoprotective transcription factor NFAT5 binds to the OPG promotor region in both cell types in vitro. Moreover, increased NFAT5 levels due to enhanced Na+ content or conditional NFAT5 expression resulted in OPG upregulation. These findings suggest that OPG is a potentially novel osmoprotective target gene and is able to regulate bone homeostasis, dependent on local Na+ content in the BM. This expands the regulatory repertoire governing OPG expression, which includes WNT- and IL-1–dependent signaling (63, 64). Although the contribution of OPG in this situation in vivo requires further detailed investigation, it is very likely that local increases in Na+ content in the BM trigger OPG expression primarily in osteoblasts, since these cells are known to be the major source of OPG in vivo (16, 40).

In summary, our data suggest that diet-dependent alterations of local Na+ content in BM impact on osteoclastogenesis and bone density. Surprisingly, LSD increased Na+ content, specifically in BM affected by myeloid cell–derived NFAT5. This local Na+ accumulation in BM of LSD-treated mice blocks RANKL-induced osteoclastogenesis by upregulating the expression of the RANKL decoy receptor OPG in an NFAT5-dependent manner (Figure 7). Our data suggest that favoring Na+ accumulation and OPG expression in BM via increasing NFAT5 activity is a potentially new method of fighting osteopenia. Our work provides insights into the mechanisms of salt-induced cessation of osteoclastogenesis and offers avenues to explain salt-induced osteopenia.

Figure 7
Schematic representation of the action of myeloid-derived NFAT5 in BM upon dietary challenges.
NFAT5 performs a dual function in bone homeostasis. On the one hand, myeloid cell–derived NFAT5 is critically involved in regulation of Na+ content in the BM, and on the other hand, NFAT5 directly controls osteoclastogenesis by binding to the OPG promotor and enhancing the expression of this osteoprotective gene.

Go to:
Methods
Supplemental Methods are available online with this article.

Animal experiments.
A total of 12 male LysMWTNfat5fl/fl (control) and 12 LysMCreNfat5fl/fl (Nfat5Δmyel) mice were either kept on a LSD (<0.1% NaCl chow [ssniff-Spezialdiäten] and tap water) or a HSD (4% NaCl chow [ssniff-Spezialdiäten] plus 0.9% saline to drink) for 2 weeks and euthanized at the age of about 22 weeks (n = 6 of each group). We analyzed bone morphogenic parameters of tibia (n = 6 of each group) via μCT and histomorphometry. Additionally, we isolated RNA from BM and analyzed Nfat5, Rankl, and Opg gene expression (n = 6 of each group). We also measured TRACP-5b and β-CTx levels in serum and assessed electrolyte content in BM (n = 6 of each group).

Nfat5-WT and Nfat5-over cells.
RAW264.7 WT macrophages (Nfat5-WT) were obtained from Cell Lines Service (400319). We additionally used Nfat5 overexpressing RAW264.7 macrophages (Nfat5-over), as described earlier (24).

Nfat5-WT and Nfat5-over cells were seeded onto 12-well cell culture plates (10,000 cells) and cultured in 1 mL α-MEM (F0925, Biochrom), supplemented with 10% FBS (P30-3306, PAN-Biotech), 1% L-glutamine (SH30034.01, GE Healthcare), and 1% antibiotics/antimycotics (A5955, Sigma-Aldrich). Induction of osteoclastogenesis was performed by adding 30 ng/mL M-CSF (576404, BioLegend) and 50 ng/mL RANKL (577102, BioLegend) at day 0 under NS¢ or under HS¢ by adding 40 mM NaCl for at least 5 days. After that time, we analyzed mRNA, protein, TRAP, and CaP resorption.

Murine osteoblast-like MC3T3-E1 cells.
Murine osteoblast like MC3T3-E1 (Sigma-Aldrich) were seeded onto 12-well cell culture plates (100,000 cells) and cultured in 1 mL α-MEM (F0925, Biochrom), supplemented with 10% FBS (P30-3306, PAN-Biotech), 1% L-glutamine (SH30034.01, GE Healthcare), and 1% antibiotics/antimycotics (A5955, Sigma-Aldrich). After 24 preincubation cells, were either kept under NS¢ or HS¢ by adding 40 mM NaCl for at least another 24 hours. After that time, we analyzed mRNA and protein expression.

siRNA transfection.
Nonsilencing siRNA (ns-siRNA) oligonucleotides were purchased from Qiagen. siRNA nucleotides directed against Nfat5 were purchased from Dharmacon’s prevalidated siRNA database (L 058868). Transfer of siRNA duplexes was performed as described previously (65). Briefly, we transferred siRNA duplexes to a 4-mm cuvette (Molecular Bioproducts) and filled up to a volume of 50 μL. We added 50 μL of a cell suspension (containing 2 × 10⁶ RAW264.7 macrophages) resolved in OPTI-MEM and pulsed in a GenePulser Xcell (Bio-Rad). Pulse conditions were 400 V, 150 μF, and 100 Ω. Using a fluorescein-labeled ns-siRNA, we routinely observed a transfection efficiency of over 90% (data not shown). After electroporation, we differentiated cells in α-MEM (supplemented as indicated in the section cell culture models) under NS¢ or HS¢ (by adding 40 mM NaCl) for 5 days. After that time, we analyzed RNA, protein, TRAP, and CaP resorption.

Isolation and purity assessment of total RNA.
We extracted total RNA by applying 0.5 mL peqGOLD TriFast (PEQLAB Biotechnology GmbH) per well and further processing according to the manufacturer’s instructions. We eluted the obtained RNA pellet in 20 μL nuclease-free water (T143, Bioscience-Grade, Carl Roth GmbH & Co.) and immediately cooled on ice. The used extraction protocol ensured good RNA integrity (RIN, 28S/18S ratio), as well as absence of genomic DNA and contamination, as shown before. For purity assessment and quantification of the eluted total RNA, OD was photometrically measured at 280 nm, 260 nm, and 230 nm (Implen).

Reverse transcription.
For cDNA synthesis, we transcribed a standardized amount of 100 ng RNA per sample using 0.1 nmol of an oligo(dT)18 primer (1 μL, SO131, Thermo Fisher Scientific), 0.1 nmol of random hexamer primers (1 μL, SO142, Invitrogen), 40 nmol dNTP mix (1 μL, 10 nmol/dNTP, Roti-Mix (PCR3, L785.2; Carl Roth), 4 μL 5× M-MLV buffer (M1705, Promega), 40 U (1 μL) of an RNase inhibitor (EO0381, Invitrogen), 200 U (1 μL) reverse transcriptase (M1705, Promega), and 20 μL nuclease-free H2O (T143, Carl Roth). We incubated the samples for 60 minutes at 37°C. After heat inactivation of reverse transcriptase (95°C, 2 minutes), the first-strand cDNA was stored until use at −20°C. cDNA synthesis was performed for all samples at the same time to minimize experimental variations. For quantitative PCR (qPCR), we diluted cDNA 1:5 with nuclease-free H2O (T143, Carl Roth GmbH & Co. KG).

qPCR.
We performed qPCR with the Mastercycler ep realplex-S thermocycler (Eppendorf AG) and 96-well PCR plates (TW-MT, 712282, Biozym Scientific GmbH), combined with BZO Seal Filmcover sheeting (712350, Biozym Scientific GmbH). Each reaction mix contained 7.5 μL SYBR Green JumpStart Taq ReadyMix (Sigma–Aldrich, S4438), as well as 7.5 pmol (0.75 μL) of the respective primer pair (3.75 pmol/primer), 1.5 μL of the respective cDNA solution (dilution 1:5), and 15 μL nuclease-free H2O (BioScience Grade T143, Carl Roth GmbH & Co. KG). To avoid technical errors due to manual pipetting, all components except the cDNA solution were prepared as a master mix. cDNA amplification was performed in 45 cycles (initial heat activation 95°C/5 minutes per cycle at 95°C/10-second denaturation, 60°C/8-second annealing, and 72°C/8-second extension) in duplets for each gene and biological sample. SYBR Green I fluorescence was quantified at 521 nm at the end of each extension step. Cycle quantification (Cq) values were determined as a second derivative maximum of the fluorescence signal curve using the software realplex (version 2.2, Eppendorf AG, CalqPlex algorithm, automatic baseline, drift correction on), and the arithmetic mean of each Cq duplet per gene and sample was used for further analysis. For normalization of target genes (relative gene expression), we used a set of 2 reference genes (Hprt/Tbp), which have been shown to be stably expressed in RAW264.7 cells under the conditions investigated. Relative gene expression was calculated as 2–ΔCq (66) with ΔCq = Cq (target gene) – Cq (mean Hprt/Tbp), divided by the respective arithmetic 2–ΔCq mean of the untreated controls at each time point to set their relative gene expression to 1 and used for statistical analysis.

All intron-flanking, gene-specific primers (Table 1) were constructed according to MIQE quality guidelines (67) using NCBI PrimerBLAST and additional software (BeaconDesigner Free Edition [Premier BioSoft International] and UNAFold [Integrated DNA Technologies Inc.]), considering absence of dimers and secondary structures at annealing temperature. The unmodified primers were synthesized and purified by Eurofins MWG Operon LLC (High Purity Salt Free Purification HPSF). For each primer pair and qPCR run, a no-template control (NTC) without cDNA was tested to assess a possible bias in results by primer dimers or contaminating DNA.

Table 1
qPCR gene, primer, target, and amplicon specifications for reference genes (Tbp, Hprt) and target genes
qPCR specificity was validated as described before using melting curve analysis and agarose gel electrophoresis (68).

Immunoblotting.
We washed cells 3 times with PBS and incubated in 8 M urea for 10 minutes on ice. Afterward, we removed the cells from the plate and centrifuged for 10 minutes at 16,200 g. We used the supernatant for immunoblot analysis. For immunoblotting, we separated equal amounts of total protein (20 μg) on 8% SDS-polyacrylamide gels under reducing conditions and electroblotted onto a polyvinylidene diflouride (PVDF) membrane. We blocked the blots with 5% nonfat milk in phosphate-buffered saline (PBS) and 0.1% Tween 20 (9127.1, Carl Roth), pH 7.5, for 1 hour at room temperature and then incubated overnight at 4°C with anti-NFAT5 (PA1-203, Thermo Fisher Scientific) diluted 1:1,000 or anti–β-actin (E1C602, EnoGene) diluted 1:3,000. After 3 washes in PBS with 0.1% Tween 20, pH7.5, we incubated the blots for 1 hour with horseradish peroxidase–conjugated anti-rabbit IgG (611-1302, Rockland) diluted 1:2,000 in blocking solution at room temperature. We visualized antibody binding using an enhanced chemiluminescence system (Pierce).

TRAP staining of cells and TRAP assay.
Histochemical TRAP staining was used to detect differentiated osteoclast-like cells after 5 days on NS or HS medium. We prepared fresh TRAP staining solution for each analysis by dissolving 0.3 mg Fast RED Violet LB (F-3381, Sigma Aldrich) in 1 mL TRAP buffer (50 mL, 0.1 M acetate buffer [35.2 mL 0.2 M sodium acetate solution], 14.8 mL 0.2 M acetic acid solution, 50 mL H2O, 10 mL 0.3 M sodium tartrate [S-8640, Sigma-Aldrich], 1 mL 10 mg/mL Naphtol AS-MX phosphate [N-5000, Sigma-Aldrich], 100 μL Triton X-100 [T-8787, Sigma Aldrich], and 38.9 mL H2Odd). We removed the medium and washed the cells with PBS. Then, these cells were fixed with 10% glutaraldehyde (G-5882, Sigma-Aldrich) for 15 minutes at 37°C. After washing the cells 2 times with prewarmed PBS, the cells were stained with 300 μL TRAP staining solution per 12 wells for 10 minutes at 37°C. We washed the cells with PBS and took pictures of 12-well plates to obtain an overview of stained or not-stained cells.

To receive quantitative data, we performed a TRAP assay using a TRAP staining kit (PMC-AK04F-COS, Cosmo Bio) with samples acquired from the supernatant. To this aim, we transferred 30 μL cell culture supernatant into a 96-well plate in duplets. Afterward, we added 50 μL chromogenic substrate including tartrate-containing buffer and incubated for 3 hours at 37°C. We measured staining efficiency at 540 nm with an ELISA reader (Multiscan GO, Thermo Fisher Scientific). Obtained data were normalized to Nfat5-WT NS or ns-siRNA NS controls.

CaP resorption assay.
For CaP resorption assay, we coated 12-well plates as previously described (69). Briefly, we prepared a simulated body fluid (SBF) by mixing 50% Tris buffer (50 mM Tris base [T1503, Sigma-Aldrich], pH 7.4, with 1 M HCl [X942.1, Carl Roth]), 25% calcium stock solution (25 mM CaCl2•H2O [C5080, Sigma-Aldrich], 1.37 M NaCl [3957.1, Carl Roth], 15 mM MgCl2•6H2O [M2670, Sigma-Aldrich] in Tris buffer, pH 7.4), and 25% phosphate stock solution (11.1 mM Na2HPO4 [P030.1, Carl Roth], 42 mM NaHCO3 [8551.1, Carl Roth] in Tris buffer, pH 7.4). CaP solution (CPS) was prepared by first adding 41 mL HCl (1 M) to 800 mL H2Odd and then dissolving 2.25 mM Na2PO4•H2O, 4 mM CaCl2•H2O, 0.14 M NaCl, and 50 mM Tris before adjusting the pH to 7.4 and the volume to 1 L. We sterilized the solution by filtration with a 0.22 μm MillexGV (MilliporeSigma). Twelve-well tissue culture plates were incubated with SBF (1 mL/well) for 3 days at room temperature. We aspirated SBF solution an added CPS (1 mL/well) for 1 day at room temperature. Then we aspirated CPS and added 70% ethanol. Afterward, CaP-coated plates were washed twice with distilled water and dried overnight at 37°C. Prior to cell plating, we incubated coated plates with FCS for 1 hour at 37°C. Then we plated 10,000 cells per 12-well and incubated for 5 days under NS or HS in α-MEM supplemented with RANKL and M-CSF, as indicated before. Activated osteoclasts resorbed this CaP coating, and the resulting gaps were quantified using ImageJ (NIH).

ChIP.
We performed ChIP using ChIP Assay Kit (17-295, MilliporeSigma) according to the manufacturer’s instructions. Briefly, about 2 × 10⁶ RAW264.7 macrophages were left unstimulated (NS) or stimulated with 40 mM NaCl (HS) for 24 hours in DMEM, high glucose, 10% FCS. We performed crosslinking by adding formaldehyde to a final concentration of 1% directly to the medium and incubated for 10 minutes at 37°C. We then removed the medium and washed the cells twice with ice-cold PBS and proteinase inhibitors (1 mM phenylmethylsulfonyl fluoride [PMSF], 1 μg/mL aprotinin, and 1 μg/mL pepstatin A). The cells were scraped into a conical tube and pelleted for 4 minutes at 2,000 rpm at 4°C. We resuspended the cells in 400 μL SDS lysis buffer including proteinase inhibitors and divided them to 200 μL aliquots. Lysates were sonicated to lengths of 700 bp, and samples were centrifuged for 10 minutes at 16,200 g at 4°C. We diluted the supernatant 10-fold in ChIP dilution buffer plus protein inhibitors and kept about 20 μL aside for input control. To reduce nonspecific background, we incubated the samples with 75 μL Protein A Agarose/Salmon Sperm DNA (50% slurry) for 30 minutes at 4°C with agitation. We removed agarose by centrifugation with 100 g 1 minute at 4°C. We added about 1 μL NFAT5 antibody (PA1-203, Thermo Fisher Scientific) for immunoprecipitation and incubated overnight with agitation (for negative control, no antibody was added). We added about 60 μL Protein A Agarose/Salmon Sperm DNA (50% slurry) to all samples and incubated for 1 hour at 4°C with agitation. Agarose was pelleted by centrifugation at 100 g for 1 minute at 4°C. We removed the supernatant, and agarose was washed for 5 minutes, first with 1 mL low-salt immune complex wash buffer, then with 1 mL high-salt immune complex wash buffer, followed by 1 mL LiCl immune complex wash buffer, and twice with 1 mL TE Buffer with rotation. After washing, we eluted the histone complex from the antibody by adding 250 μL elution buffer (1% SDS, 0.1 M NaHCO3) to the pelleted agarose, followed by incubation at room temperature for 15 minutes with rotation. Agarose was spun down, and the supernatant was collected. We repeated this step, and the supernatant fractions were pooled (total volume 500 μL). About 20 μL 5 M NaCl was added to the eluates, and crosslinks were reversed by heating at 65°C for 4 hours. After that, we added 10 μL of 0.5 M EDTA, 20 μL 1 M Tris-HCl, pH 6.5 and 2 μL of 10 mg/mL Proteinase K to eluates and incubated for 1 hour at 45°C. We recovered the DNA by adding 500 μL phenol/chloroform to the samples. After centrifugation, this step was repeated with the supernatant. We centrifuged samples at 16,200 g for 10 minutes, and the supernatant was precipitated with isopropanol overnight at –20°C. Then, samples were centrifuged at 13,000 rpm for 30 minutes at 4°C. We washed the pellet twice with 70% ethanol. After that, pellets were dried and resuspended in 15 μL Tris-HCl, pH 8. We used about 5 μL of samples and 1 μL of input controls for PCR. The following PCR conditions were used for each sample: 1 μL 10× Puffer (12161567001, Roche), 0.25 μL fwd primer 5′ - TGTCTGCGTGTGGGATAGTT - 3′, 0.25 μL rev primer 5′ - TCCTGGGCTACGCTGTAAA - 3′, 0.2 μL dNTPs (11581295001, Roche), and 0.1 μL Taq-Polymerase (120329929001, Roche). H2Odd was added up to 10 μL. Amplification protocol included the following: (a) 95°C for 5 minutes; (b) 95°C for 20 seconds, (c) 60°C for 45 seconds, and (d) 4°C. Steps b and c were repeated 40×. We loaded samples on a 1% agarose gel and analyzed under UV light.

OPG ELISA.
OPG ELISA was obtained from Thermo Fisher Scientific (EMTNFRSF11B) and performed according to the manufacturer’s instructions.

TRACP-5b ELISA.
TRACP-5b Elisa was obtained from MyBiosource (MBS763504) and performed according to the manufacturer’s instructions.

μCT.
For μCT, we used the GE V-Tome-X S240 from GE Healthcare. Tibiae of 20-week-old mice were scanned using Fast-Scan protocol (33 minutes, nanofocus tube, voxel size 4.5 μm; magnification, 44.4×, picture number 2,000; timing 1,000 ms; voltage 35 kV; electricity 145). We obtained bone morphometric parameters in a region of interest (ROI) ranging from 0.2–2 mm below the growth boundary. We quantified BV/TV and trabecular thickness (Tb.Th) using VGL3.0 (Volume graphics GmbH).

Histological analysis.
Tibiae were fixed in 4% paraformaldehyde, stored in 70% ethanol until decalcification, embedded in paraffin, and sectioned at 5 μm. We deparaffinized slides overnight at 37°C and hydrogenated them. To assess bone histomorphometrically, we performed TRAP and toluidine blue stainings.

For TRAP staining, we placed the section in a freshly prepared TRAP buffer consisting of 1.64 g sodium acetate (6773.1, Carl Roth) and 23 g of disodium tartrate dihydrate (T110.1, Carl Roth) to 500 mL of H2Odd (pH 5) for 10 minutes at room temperature. Sections were then placed in a freshly prepared staining solution consisting of 40 mg Naphtol AS-MX Phosphate Disodium Salt (N5000, Sigma-Aldrich), 4 mL N,N-dimethylformamide (D4551, Sigma-Aldrich), 240 mg Fast Red Violet LB Salt (F3381, Sigma-Aldrich), 2 mL Triton X-100 (T9284, Sigma-Aldrich), and 200 mL previously prepared TRAP buffer. The sections were incubated at 37°C for 2 hours, rinsed in H2Odd, and counterstained for 3 minutes with filtered Hayer’s hematoxylin solution (51275, Sigma-Aldrich) at room temperature. Subsequently, the sections were covered immediately with Aquatex (1085620050, Merck).

For toluidine blue stainings, we put the deparaffinized and rehydrogenated slides in staining solution containing toluidine blue (89640, Fluka) and sodium-tetraborate (221732, Sigma-Aldrich) for 1 minute. After incubation for 10 minutes in H2Odd and for at least 20 minutes in xylene, the coverslips were applied with entellan (1.07961.0500, Merck).

Quantitative histomorphometry was performed on TRAP and toluidine blue–stained sections according to standard protocols (70) using the Osteomeasure histomorphometry system (Osteometrix). Experiments were performed in a blinded fashion.

Na+ measurements.
Femur BMs of mice were flushed with H2Odd. Wet weight of the flushed BM was determined and samples were stored at 4°C until analysis. Na+ was measured by atomic absorption spectrometry after appropriate dilution (Model 3100, Perkin Elmer).

Statistics.
Statistics were performed with the software application SPSS Statistics 24 (IBM). Descriptive statistics are given as mean ± SEM. Two-tailed, unpaired Student’s t test was used, where appropriate. Otherwise, the experimental groups were independently compared by 1-way ANOVAs, which were validated by applying Welch’s test, since homogeneity of variance was absent. Post hoc tests using the Games-Howell approach for heterogeneous variances were used for pairwise comparisons. μCT analysis and Na+ measurements consisted of comparison of means of data from animal experiments calculated by multivariate or univariate analysis using the General Linear Measurements (GLM) procedure. All differences were considered statistically significant at P ≤ 0.05.

Study approval.
All animal experiments were performed according to German law in compliance with the ARRIVE guidelines. The present study in animals was reviewed and approved by the Regierung von Unterfranken, Würzburg.

Go to:
Author contributions
AS planned and performed experiments and wrote the manuscript. PN performed experiments. AB designed experiments and helped with analysis of μCT and bone morphology. WN provided critical material and contributed to manuscript preparation. JT and PP were involved in the planning of experiments, trial design, and manuscript editing. CK and JJ planned and supervised the experiments and contributed to manuscript preparation and revision.

Go to:
Supplementary Material
Supplemental data:
Click here to view.(744K, pdf)
Go to:
Acknowledgments
The authors thank Kathrin Bauer and Eva Zaglauer for their technical support in performing the qPCR analyses and cell culture experiments, as well as Monika Nowottny for animal genotyping and Birgit Striegl for performing the μCT analysis (DFG-Nr.: INST 102/11-1 FUGG). AS received funding from the Faculty for Medicine Regensburg (ReForM A), CK from the German Orthodontic Society DGKFO (Kirschneck 08/2018), and JJ from the German Research Foundation DFG (JA1993/4-1).

Go to:
Version Changes
Go to:
Version 1. 12/05/2019
Electronic publication

Go to:
Footnotes
Conflict of interest: The authors have declared that no conflict of interest exists.

Copyright: © 2019, American Society for Clinical Investigation.

Reference information: JCI Insight. 2019;4(23):e127868.JCI Insight - Osteoprotective action of low-salt diet requires myeloid cell–derived NFAT5.

Go to:
References
1. Feng X, Teitelbaum SL. Osteoclasts: New Insights. Bone Res. 2013;1(1):11–26. doi: 10.4248/BR201301003. [PMC free article] [PubMed] [CrossRef] [Google Scholar]
2. Proff P, Römer P. The molecular mechanism behind bone remodelling: a review. Clin Oral Investig. 2009;13(4):355–362. doi: 10.1007/s00784-009-0268-2. [PubMed] [CrossRef] [Google Scholar]
3. Parfitt AM. Osteonal and hemi-osteonal remodeling: the spatial and temporal framework for signal traffic in adult human bone. J Cell Biochem. 1994;55(3):273–286. doi: 10.1002/jcb.240550303. [PubMed] [CrossRef] [Google Scholar]
4. Kong YY, Penninger JM. Molecular control of bone remodeling and osteoporosis. Exp Gerontol. 2000;35(8):947–956. doi: 10.1016/S0531-5565(00)00178-9. [PubMed] [CrossRef] [Google Scholar]
5. Raisz LG. Pathogenesis of osteoporosis: concepts, conflicts, and prospects. J Clin Invest. 2005;115(12):3318–3325. doi: 10.1172/JCI27071. [PMC free article] [PubMed] [CrossRef] [Google Scholar]
6. Schett G, Teitelbaum SL. Osteoclasts and Arthritis. J Bone Miner Res. 2009;24(7):1142–1146. doi: 10.1359/jbmr.090533. [PubMed] [CrossRef] [Google Scholar]
7. Ducy P, Schinke T, Karsenty G. The osteoblast: a sophisticated fibroblast under central surveillance. Science. 2000;289(5484):1501–1504. doi: 10.1126/science.289.5484.1501. [PubMed] [CrossRef] [Google Scholar]
8. Teitelbaum SL. Bone resorption by osteoclasts. Science. 2000;289(5484):1504–1508. doi: 10.1126/science.289.5484.1504. [PubMed] [CrossRef] [Google Scholar]
9. Anderson DM, et al. A homologue of the TNF receptor and its ligand enhance T-cell growth and dendritic-cell function. Nature. 1997;390(6656):175–179. doi: 10.1038/36593. [PubMed] [CrossRef] [Google Scholar]
10. Wong BR, et al. TRANCE is a novel ligand of the tumor necrosis factor receptor family that activates c-Jun N-terminal kinase in T cells. J Biol Chem. 1997;272(40):25190–25194. doi: 10.1074/jbc.272.40.25190. [PubMed] [CrossRef] [Google Scholar]
11. Bucay N, et al. osteoprotegerin-deficient mice develop early onset osteoporosis and arterial calcification. Genes Dev. 1998;12(9):1260–1268. doi: 10.1101/gad.12.9.1260. [PMC free article] [PubMed] [CrossRef] [Google Scholar]
12. Lacey DL, et al. Osteoprotegerin ligand is a cytokine that regulates osteoclast differentiation and activation. Cell. 1998;93(2):165–176. doi: 10.1016/S0092-8674(00)81569-X. [PubMed] [CrossRef] [Google Scholar]
13. Simonet WS, et al. Osteoprotegerin: a novel secreted protein involved in the regulation of bone density. Cell. 1997;89(2):309–319. doi: 10.1016/S0092-8674(00)80209-3. [PubMed] [CrossRef] [Google Scholar]
14. Boyce BF, Xing L. Functions of RANKL/RANK/OPG in bone modeling and remodeling. Arch Biochem Biophys. 2008;473(2):139–146. doi: 10.1016/j.abb.2008.03.018. [PMC free article] [PubMed] [CrossRef] [Google Scholar]
15. Okamoto K, Takayanagi H. Osteoimmunology. Cold Spring Harb Perspect Med. 2019;9(1):a031245. doi: 10.1101/cshperspect.a031245. [PMC free article] [PubMed] [CrossRef] [Google Scholar]
16. Takayanagi H. Osteoimmunology: shared mechanisms and crosstalk between the immune and bone systems. Nat Rev Immunol. 2007;7(4):292–304. doi: 10.1038/nri2062. [PubMed] [CrossRef] [Google Scholar]
17. Kloss L, Meyer JD, Graeve L, Vetter W. Sodium intake and its reduction by food reformulation in the European Union – a review. NFS Journal. 2015;1:9–19. doi: 10.1016/j.nfs.2015.03.001. [CrossRef] [Google Scholar]
18. Rakova N, et al. Increased salt consumption induces body water conservation and decreases fluid intake. J Clin Invest. 2017;127(5):1932–1943. doi: 10.1172/JCI88530. [PMC free article] [PubMed] [CrossRef] [Google Scholar]
19. Rakova N, et al. Long-term space flight simulation reveals infradian rhythmicity in human Na(+) balance. Cell Metab. 2013;17(1):125–131. doi: 10.1016/j.cmet.2012.11.013. [PubMed] [CrossRef] [Google Scholar]
20. Kopp C, et al. 23Na magnetic resonance imaging-determined tissue sodium in healthy subjects and hypertensive patients. Hypertension. 2013;61(3):635–640. doi: 10.1161/HYPERTENSIONAHA.111.00566. [PubMed] [CrossRef] [Google Scholar]
21. Titze J, et al. Hypertension, sodium retention, calcium excretion and osteopenia in Dahl rats. J Hypertens. 2004;22(4):803–810. doi: 10.1097/00004872-200404000-00024. [PubMed] [CrossRef] [Google Scholar]
22. Titze J, et al. Spooky sodium balance. Kidney Int. 2014;85(4):759–767. doi: 10.1038/ki.2013.367. [PubMed] [CrossRef] [Google Scholar]
23. Wiig H, et al. Immune cells control skin lymphatic electrolyte homeostasis and blood pressure. J Clin Invest. 2013;123(7):2803–2815. doi: 10.1172/JCI60113. [PMC free article] [PubMed] [CrossRef] [Google Scholar]
24. Machnik A, et al. Macrophages regulate salt-dependent volume and blood pressure by a vascular endothelial growth factor-C-dependent buffering mechanism. Nat Med. 2009;15(5):545–552. doi: 10.1038/nm.1960. [PubMed] [CrossRef] [Google Scholar]
25. Machnik A, et al. Mononuclear phagocyte system depletion blocks interstitial tonicity-responsive enhancer binding protein/vascular endothelial growth factor C expression and induces salt-sensitive hypertension in rats. Hypertension. 2010;55(3):755–761. doi: 10.1161/HYPERTENSIONAHA.109.143339. [PubMed] [CrossRef] [Google Scholar]
26. López-Rodríguez C, Aramburu J, Jin L, Rakeman AS, Michino M, Rao A. Bridging the NFAT and NF-kappaB families: NFAT5 dimerization regulates cytokine gene transcription in response to osmotic stress. Immunity. 2001;15(1):47–58. doi: 10.1016/S1074-7613(01)00165-0. [PubMed] [CrossRef] [Google Scholar]
27. Ko BC, Turck CW, Lee KW, Yang Y, Chung SS. Purification, identification, and characterization of an osmotic response element binding protein. Biochem Biophys Res Commun. 2000;270(1):52–61. doi: 10.1006/bbrc.2000.2376. [PubMed] [CrossRef] [Google Scholar]
28. Miyakawa H, Woo SK, Dahl SC, Handler JS, Kwon HM. Tonicity-responsive enhancer binding protein, a rel-like protein that stimulates transcription in response to hypertonicity. Proc Natl Acad Sci USA. 1999;96(5):2538–2542. doi: 10.1073/pnas.96.5.2538. [PMC free article] [PubMed] [CrossRef] [Google Scholar]
29. Nordin BE, Need AG, Morris HA, Horowitz M. The nature and significance of the relationship between urinary sodium and urinary calcium in women. J Nutr. 1993;123(9):1615–1622. doi: 10.1093/jn/123.9.1615. [PubMed] [CrossRef] [Google Scholar]
30. Park SM, et al. High Dietary Sodium Intake Assessed by 24-hour Urine Specimen Increase Urinary Calcium Excretion and Bone Resorption Marker. J Bone Metab. 2014;21(3):189–194. doi: 10.11005/jbm.2014.21.3.189. [PMC free article] [PubMed] [CrossRef] [Google Scholar]
31. Frings-Meuthen P, Baecker N, Heer M. Low-grade metabolic acidosis may be the cause of sodium chloride-induced exaggerated bone resorption. J Bone Miner Res. 2008;23(4):517–524. [PubMed] [Google Scholar]
32. Hannon MJ, Verbalis JG. Sodium homeostasis and bone. Curr Opin Nephrol Hypertens. 2014;23(4):370–376. doi: 10.1097/01.mnh.0000447022.51722.f4. [PubMed] [CrossRef] [Google Scholar]
33. Usala RL, et al. Hyponatremia Is Associated With Increased Osteoporosis and Bone Fractures in a Large US Health System Population. J Clin Endocrinol Metab. 2015;100(8):3021–3031. doi: 10.1210/jc.2015-1261. [PMC free article] [PubMed] [CrossRef] [Google Scholar]
34. Verbalis JG, et al. Hyponatremia-induced osteoporosis. J Bone Miner Res. 2010;25(3):554–563. doi: 10.1359/jbmr.090827. [PMC free article] [PubMed] [CrossRef] [Google Scholar]
35. Devine A, Criddle RA, **** IM, Kerr DA, Prince RL. A longitudinal study of the effect of sodium and calcium intakes on regional bone density in postmenopausal women. Am J Clin Nutr. 1995;62(4):740–745. doi: 10.1093/ajcn/62.4.740. [PubMed] [CrossRef] [Google Scholar]
36. Harrington JT, et al. Risedronate rapidly reduces the risk for nonvertebral fractures in women with postmenopausal osteoporosis. Calcif Tissue Int. 2004;74(2):129–135. doi: 10.1007/s00223-003-0042-4. [PubMed] [CrossRef] [Google Scholar]
37. Goulding A, Campbell DR. Effects of oral loads of sodium chloride on bone composition in growing rats consuming ample dietary calcium. Miner Electrolyte Metab. 1984;10(1):58–62. [PubMed] [Google Scholar]
38. Wu L, et al. Increased levels of sodium chloride directly increase osteoclastic differentiation and resorption in mice and men. Osteoporos Int. 2017;28(11):3215–3228. doi: 10.1007/s00198-017-4163-4. [PMC free article] [PubMed] [CrossRef] [Google Scholar]
39. Barsony J, Sugimura Y, Verbalis JG. Osteoclast response to low extracellular sodium and the mechanism of hyponatremia-induced bone loss. J Biol Chem. 2011;286(12):10864–10875. doi: 10.1074/jbc.M110.155002. [PMC free article] [PubMed] [CrossRef] [Google Scholar]
40. Tsukasaki M, Takayanagi H. Osteoimmunology: evolving concepts in bone-immune interactions in health and disease. Nat Rev Immunol. 2019;19(10):626–642. doi: 10.1038/s41577-019-0178-8. [PubMed] [CrossRef] [Google Scholar]
41. Binger KJ, et al. High salt reduces the activation of IL-4- and IL-13-stimulated macrophages. J Clin Invest. 2015;125(11):4223–4238. doi: 10.1172/JCI80919. [PMC free article] [PubMed] [CrossRef] [Google Scholar]
42. Neubert P, et al. HIF1A and NFAT5 coordinate Na+-boosted antibacterial defense via enhanced autophagy and autolysosomal targeting. Autophagy. 2019;15(11):1899–1916. doi: 10.1080/15548627.2019.1596483. [PMC free article] [PubMed] [CrossRef] [Google Scholar]
43. Ziomber A, et al. Sodium-, potassium-, chloride-, and bicarbonate-related effects on blood pressure and electrolyte homeostasis in deoxycorticosterone acetate-treated rats. Am J Physiol Renal Physiol. 2008;295(6):F1752–F1763. doi: 10.1152/ajprenal.00531.2007. [PubMed] [CrossRef] [Google Scholar]
44. Kitada K, et al. High salt intake reprioritizes osmolyte and energy metabolism for body fluid conservation. J Clin Invest. 2017;127(5):1944–1959. doi: 10.1172/JCI88532. [PMC free article] [PubMed] [CrossRef] [Google Scholar]
45. Jantsch J, et al. Cutaneous Na+ storage strengthens the antimicrobial barrier function of the skin and boosts macrophage-driven host defense. Cell Metab. 2015;21(3):493–501. doi: 10.1016/j.cmet.2015.02.003. [PMC free article] [PubMed] [CrossRef] [Google Scholar]
46. Matthias J, et al. Sodium chloride is an ionic checkpoint for human TH2 cells and shapes the atopic skin microenvironment. Sci Transl Med. 2019;11(480):eaau0683. doi: 10.1126/scitranslmed.aau0683. [PubMed] [CrossRef] [Google Scholar]
47. Carbone LD, et al. The renin-angiotensin aldosterone system and osteoporosis: findings from the Women’s Health Initiative. Osteoporos Int. 2019;30(10):2039–2056. doi: 10.1007/s00198-019-05041-3. [PubMed] [CrossRef] [Google Scholar]
48. Chen XF, et al. Inhibition on angiotensin-converting enzyme exerts beneficial effects on trabecular bone in orchidectomized mice. Pharmacol Rep. 2018;70(4):705–711. doi: 10.1016/j.pharep.2018.02.008. [PMC free article] [PubMed] [CrossRef] [Google Scholar]
49. Schatz V, et al. Elementary immunology: Na+ as a regulator of immunity. Pediatr Nephrol. 2017;32(2):201–210. doi: 10.1007/s00467-016-3349-x. [PMC free article] [PubMed] [CrossRef] [Google Scholar]
50. Berry MR, et al. Renal Sodium Gradient Orchestrates a Dynamic Antibacterial Defense Zone. Cell. 2017;170(5):860–874.e19. doi: 10.1016/j.cell.2017.07.022. [PubMed] [CrossRef] [Google Scholar]
51. Zhang WC, et al. Elevated sodium chloride drives type I interferon signaling in macrophages and increases antiviral resistance. J Biol Chem. 2018;293(3):1030–1039. doi: 10.1074/jbc.M117.805093. [PMC free article] [PubMed] [CrossRef] [Google Scholar]
52. Ravesloot JH, Eisen T, Baron R, Boron WF. Role of Na-H exchangers and vacuolar H+ pumps in intracellular pH regulation in neonatal rat osteoclasts. J Gen Physiol. 1995;105(2):177–208. doi: 10.1085/jgp.105.2.177. [PMC free article] [PubMed] [CrossRef] [Google Scholar]
53. Gupta A, Miyauchi A, Fujimori A, Hruska KA. Phosphate transport in osteoclasts: a functional and immunochemical characterization. Kidney Int. 1996;49(4):968–974. doi: 10.1038/ki.1996.137. [PubMed] [CrossRef] [Google Scholar]
54. Nordström T, et al. Regulation of cytoplasmic pH in osteoclasts. Contribution of proton pumps and a proton-selective conductance. J Biol Chem. 1995;270(5):2203–2212. doi: 10.1074/jbc.270.5.2203. [PubMed] [CrossRef] [Google Scholar]
55. Hofstetter W, Siegrist M, Simonin A, Bonny O, Fuster DG. Sodium/hydrogen exchanger NHA2 in osteoclasts: subcellular localization and role in vitro and in vivo. Bone. 2010;47(2):331–340. doi: 10.1016/j.bone.2010.04.605. [PubMed] [CrossRef] [Google Scholar]
56. Moonga BS, et al. Identification and characterization of a sodium/calcium exchanger, NCX-1, in osteoclasts and its role in bone resorption. Biochem Biophys Res Commun. 2001;283(4):770–775. doi: 10.1006/bbrc.2001.4870. [PubMed] [CrossRef] [Google Scholar]
57. Li JP, Kajiya H, Okamoto F, Nakao A, Iwamoto T, Okabe K. Three Na+/Ca2+ exchanger (NCX) variants are expressed in mouse osteoclasts and mediate calcium transport during bone resorption. Endocrinology. 2007;148(5):2116–2125. doi: 10.1210/en.2006-1321. [PubMed] [CrossRef] [Google Scholar]
58. Albano G, et al. Increased bone resorption by osteoclast-specific deletion of the sodium/calcium exchanger isoform 1 (NCX1) Pflugers Arch. 2017;469(2):225–233. doi: 10.1007/s00424-016-1923-5. [PubMed] [CrossRef] [Google Scholar]
59. Gupta A, Guo XL, Alvarez UM, Hruska KA. Regulation of sodium-dependent phosphate transport in osteoclasts. J Clin Invest. 1997;100(3):538–549. doi: 10.1172/JCI119563. [PMC free article] [PubMed] [CrossRef] [Google Scholar]
60. Makihira S, et al. Blocking of sodium and potassium ion-dependent adenosine triphosphatase-α1 with ouabain and vanadate suppresses cell-cell fusion during RANKL-mediated osteoclastogenesis. Eur J Pharmacol. 2011;670(2-3):409–418. doi: 10.1016/j.ejphar.2011.08.044. [PubMed] [CrossRef] [Google Scholar]
61. Baron R, Neff L, Roy C, Boisvert A, Caplan M. Evidence for a high and specific concentration of (Na+,K+)ATPase in the plasma membrane of the osteoclast. Cell. 1986;46(2):311–320. doi: 10.1016/0092-8674(86)90748-8. [PubMed] [CrossRef] [Google Scholar]
62. Yasuda H, et al. Osteoclast differentiation factor is a ligand for osteoprotegerin/osteoclastogenesis-inhibitory factor and is identical to TRANCE/RANKL. Proc Natl Acad Sci USA. 1998;95(7):3597–3602. doi: 10.1073/pnas.95.7.3597. [PMC free article] [PubMed] [CrossRef] [Google Scholar]
63. McCarthy TL, Kallen CB, Centrella M. β-Catenin independent cross-control between the estradiol and Wnt pathways in osteoblasts. Gene. 2011;479(1-2):16–28. doi: 10.1016/j.gene.2011.02.002. [PMC free article] [PubMed] [CrossRef] [Google Scholar]
64. Vidal ON, Sjögren K, Eriksson BI, Ljunggren O, Ohlsson C. Osteoprotegerin mRNA is increased by interleukin-1 alpha in the human osteosarcoma cell line MG-63 and in human osteoblast-like cells. Biochem Biophys Res Commun. 1998;248(3):696–700. doi: 10.1006/bbrc.1998.9035. [PubMed] [CrossRef] [Google Scholar]
65. Siegert I, Schatz V, Prechtel AT, Steinkasserer A, Bogdan C, Jantsch J. Electroporation of siRNA into mouse BM-derived macrophages and dendritic cells. Methods Mol Biol. 2014;1121:111–119. doi: 10.1007/978-1-4614-9632-8_9. [PubMed] [CrossRef] [Google Scholar]
66. Livak KJ, Schmittgen TD. Analysis of relative gene expression data using real-time quantitative PCR and the 2(-Delta Delta C(T)) Method. Methods. 2001;25(4):402–408. doi: 10.1006/meth.2001.1262. [PubMed] [CrossRef] [Google Scholar]
67. Bustin SA, et al. The MIQE guidelines: minimum information for publication of quantitative real-time PCR experiments. Clin Chem. 2009;55(4):611–622. doi: 10.1373/clinchem.2008.112797. [PubMed] [CrossRef] [Google Scholar]
68. Kirschneck C, Batschkus S, Proff P, Köstler J, Spanier G, Schröder A. Valid gene expression normalization by RT-qPCR in studies on hPDL fibroblasts with focus on orthodontic tooth movement and periodontitis. Sci Rep. 2017;7(1):14751. doi: 10.1038/s41598-017-15281-0. [PMC free article] [PubMed] [CrossRef] [Google Scholar]
69. Maria SM, Prukner C, Sheikh Z, Mueller F, Barralet JE, Komarova SV. Reproducible quantification of osteoclastic activity: characterization of a biomimetic calcium phosphate assay. J Biomed Mater Res Part B Appl Biomater. 2014;102(5):903–912. doi: 10.1002/jbm.b.33071. [PubMed] [CrossRef] [Google Scholar]
70. Parfitt AM, et al. Bone histomorphometry: standardization of nomenclature, symbols, and units. Report of the ASBMR Histomorphometry Nomenclature Committee. J Bone Miner Res. 1987;2(6):595–610. [PubMed] [Google Scholar]
 
EMF Mitigation - Flush Niacin - Big 5 Minerals

Similar threads

Back
Top Bottom