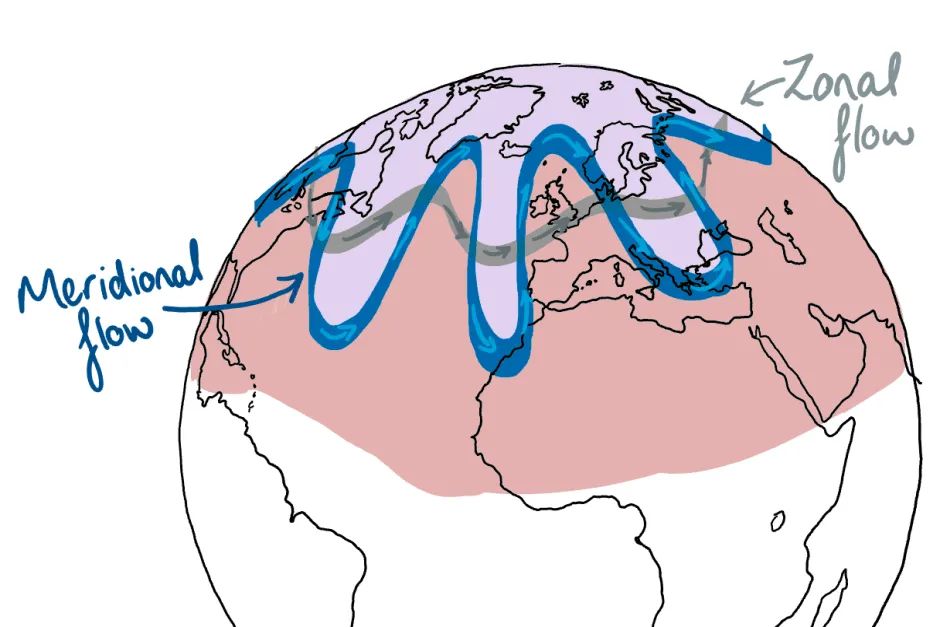
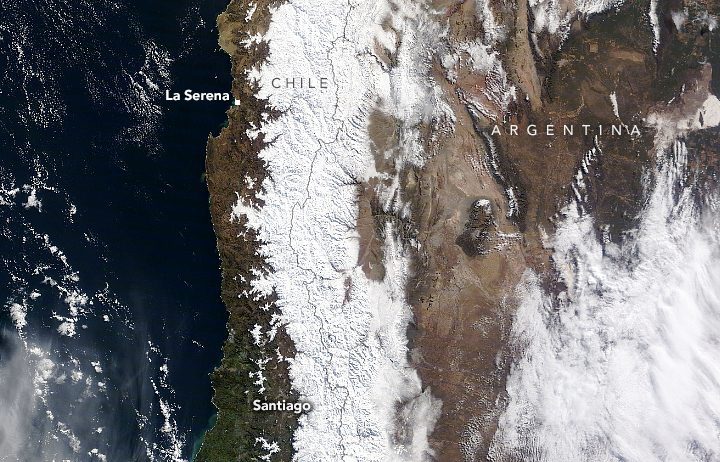
Priming the sheeple…The red color makes the similar temperatures in the 2 photos look more alarming. Are you panicked yet?
View attachment 39308
-
By using this site you agree to the terms, rules, and privacy policy.
-
Charlie's Restoration Giveaway #2 (Entire Home EMF Mitigation & Protection Along With Personal Protection) - Click Here To Enter
-
Dear Carnivore Dieters, A Muscle Meat Only Diet is Extremely Healing Because it is a Low "vitamin A" Diet. This is Why it Works so Well...
Rest the rest of this post by clicking here
-
The Forum is transitioning to a subscription-based membership model - Click Here To Read
Click Here if you want to upgrade your account
If you were able to post but cannot do so now, send an email to admin at raypeatforum dot com and include your username and we will fix that right up for you.
Unbelievable Climate Change BS
- Thread starter Donttreadonme
- Start date


EMF Mitigation - Flush Niacin - Big 5 Minerals