togeprrriii
Member
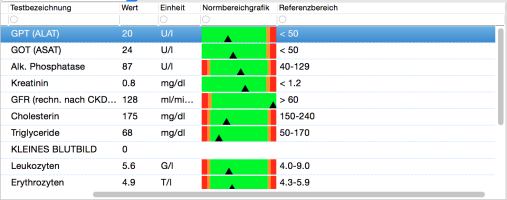
Hey guys, been looking for a way to depict lab works in one single neat table/document whatever. I have different lab results on different sheets of paper from different labs and I would like to put it all in one document. That alone would be easy, I know, but I want to include some graphic representation where I can depict how one given lab result falls within the given reference range. You know, just these standard graphs that you get from labs, but I want to be able to create such a document myself. I attached an example of what I am loooking for below. (Sorry if this is a total noob request, I genuinely don't know how to do it  and couldn't find something like a proper template for libreoffice or software or something like this)
cheers!
and couldn't find something like a proper template for libreoffice or software or something like this)cheers!