Why Do People Think New Coronavirus Is A Normal Flu?

Peater Piper

Member
Joined
Mar 18, 2016
Messages
817
Please look at total mortality. Covid makes it seem like we suddenly found THE cure for heart attack, cancer etc. as they get diagnosed pneumonia/covid and thus have plummeted.

Last time i looked at total mortality it was at an unprecedented all-time low about a week ago. Not just slightly or about, but off-the-charts low. Back then the data was showing covid-19 is saving people's lives.
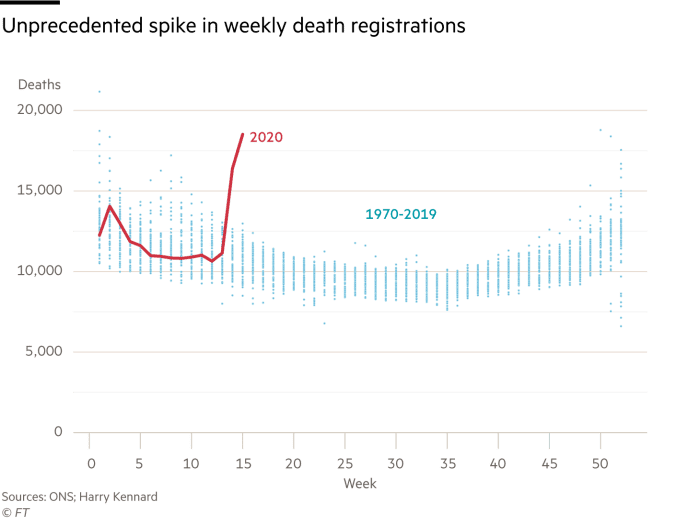
For where? It is down in the USA, presumably from a lack of vehicular accidents and other causes due to quarantining, but deaths that might be associated with COVID-19, particularly pneumonia, are up. NYC had by far their worst mortality month this century. In Europe, there's 8-10 countries that are at above their highest excess mortality rates since at least 2015. And I keep qualifying that traditionally deaths are way down at this time of year. They shouldn't be peaking, that speaks to the unusual nature of the situation. If this had been in full swing two months ago, things would be much worse. Wuhan had over 20k excess deaths over the course of a couple of months.
 

tankasnowgod

Member
Joined
Jan 25, 2014
Messages
8,131
Please look at total mortality. Covid makes it seem like we suddenly found THE cure for heart attack, cancer etc. as they get diagnosed pneumonia/covid and thus have plummeted.

Last time i looked at total mortality it was at an unprecedented all-time low about a week ago. Not just slightly or about, but off-the-charts low. Back then the data was showing covid-19 is saving people's lives.

Some people are noticing this...

April: U.S. Death Rate From All Causes (Including COVID-19) At Multi-Year LOW

"On April 5th, the U.S. saw 1,344 COVID-19 deaths, as the number of cases in the U.S. accelerated. The overall number of deaths in the U.S., or the crude death rate did not show a correlated rise.

At the very least, this data shows we need to analyze COVID-19 deaths in the context of the broader U.S. mortality rate from all causes. It appears normal deaths are being attributed to COVID-19 if the patient is COVID-19+, even if another underlying chronic cause is responsible."
 

Peater Piper

Member
Joined
Mar 18, 2016
Messages
817
Very high? Nope. Slightly higher than normal? Someplaces. But not even really out of line with seasonal averages.
It's at or above the previous peaks since 2015. How is that not high? And it's well out of line with seasonal averages when looking at the April numbers compared to past years.
 

tankasnowgod

Member
Joined
Jan 25, 2014
Messages
8,131
It's at or above the previous peaks since 2015. How is that not high? And it's well out of line with seasonal averages when looking at the April numbers compared to past years.

Right at previous peaks isn't "very high," That is practically the definition of "seasonal average." Nor is the peak nearly as wide. Some of the April numbers do appear higher than previous Aprils, but the previous months are lower than comparable months. This could be due to delays in reporting, as, unlike previous years, hundreds of thousands of medical staff have been laid off to prepare for an anticipated pandemic.
 

Peater Piper

Member
Joined
Mar 18, 2016
Messages
817
That is practically the definition of "seasonal average."
If you average out the seasonal peaks, this looks even worse, since it's matching or exceeding (by a significant margin in some instances) the highest peak for each country during the past five winters. Averaging the peaks lowers the bar, not raises it.
 

tankasnowgod

Member
Joined
Jan 25, 2014
Messages
8,131
If you average out the seasonal peaks, this looks even worse, since it's matching or exceeding (by a significant margin in some instances) the highest peak for each country during the past five winters. Averaging the peaks lowers the bar, not raises it.

Wrong. It's the number of weeks it's elevated. For most of the data on EuroMomo, the current data looks like a spike. The other peaks have more of a U or W shape, meaning there was a rise up over a few weeks, then down over a few. It's the exact opposite of what you said. The spikes look like reporting delays.
 

pepsi

Member
Joined
Apr 15, 2013
Messages
177
Location
Texas
All the media focus on this pandemic and govt issued lockdowns is sending people into
over stress mode. This is detrimental to the older and sick population and its sending others into suicidal ideations.

Would there have been less deaths from COVID19 if the stay at home orders and fear mongering
were never implemented in the first place? Possibly.

But its a question that can never be answered. The govts are being very irresponsible and should have never taken it
this far. Their actions are more harmful than the virus itself.


New Page Title Here


"Stress, including fear (Campos, et al., 2013) and isolation (Zlatković & Filipović, 2013) can activate the formation of nitric oxide, and various mediators of inflammation also activate it. The nitric oxide in a person's exhaled breath can be used to diagnose some diseases, and it probably also reflects the level of their emotional well-being."
 

Entropy

Member
Joined
Apr 11, 2015
Messages
163
Looks like this study is affirming the Santa Clara Study
L.A. County Antibody Tests Suggest the Fatality Rate for COVID-19 Is Much Lower Than People Feared

Sood addressed two of the methodological concerns that were raised by a recent study of Santa Clara County residents, which likewise estimated that the COVID-19 fatality rate is not far from the rate for the flu. Critics of that study suggested it may have been undermined by biased sampling and false-positive antibody test results.

The sample for the Los Angeles County study, Sood said, was randomly drawn from a database maintained by the LRW Group, a market research firm. The researchers capped subjects representing specific demographic groups so the sample would reflect the county's adult population.

As for the accuracy of the antibody tests, Sood said validation by the manufacturer of the test kits, Premier Biotech, found a false positive rate of 0.5 percent in 371 samples. In subsequent tests by a Stanford laboratory, there were no false positives. "We think that the false positive rate of the tests is really low," Sood said
 

Peater Piper

Member
Joined
Mar 18, 2016
Messages
817
Wrong. It's the number of weeks it's elevated. For most of the data on EuroMomo, the current data looks like a spike. The other peaks have more of a U or W shape, meaning there was a rise up over a few weeks, then down over a few. It's the exact opposite of what you said. The spikes look like reporting delays.
I don't see why you think this must follow the same trend. A sudden rise in all-cause mortality over a few weeks will cause a much steeper rise than the gradual beginning and ending of cold and flu season. Regardless, all of this data will be validated at some point, at which point we can deal with clear numbers instead of speculation.
 

tankasnowgod

Member
Joined
Jan 25, 2014
Messages
8,131
I don't see why you think this must follow the same trend. A sudden rise in all-cause mortality over a few weeks will cause a much steeper rise than the gradual beginning and ending of cold and flu season. Regardless, all of this data will be validated at some point, at which point we can deal with clear numbers instead of speculation.

It doesn't have to. The point is, about the same or fewer people have died, even with those spikes. After all, 400 times 4 is a bigger number than 300 times 3 plus 500. You are essentially arguing that the second number is bigger, even though it's very clearly 200 lower.

I'd be fine with everything being sorted out later, if lives, economies, and countries weren't being utterly destroyed in the process. And the lives I'm referring to are the lives being destroyed because of the lockdowns.
 

Peater Piper

Member
Joined
Mar 18, 2016
Messages
817
It doesn't have to. The point is, about the same or fewer people have died, even with those spikes. After all, 400 times 4 is a bigger number than 300 times 3 plus 500. You are essentially arguing that the second number is bigger, even though it's very clearly 200 lower.
I doubt the deaths are suddenly going to drop back to baseline, I expect the curves to flatten out and then slowly decline. Note that Euromomo has always displayed sharp declines for the current curves, even back when Italy was just starting. It doesn't indicate deaths are falling significantly yet, I think it's just lag as new deaths have yet to be reported. Right now you're essentially comparing six weeks since the current epidemic started to take hold in Europe to 12 weeks for peak cold and flu seasons, and even then it's a tough comparison since we really don't know how much quarantining impacts all-cause mortality.
 

tankasnowgod

Member
Joined
Jan 25, 2014
Messages
8,131
I doubt the deaths are suddenly going to drop back to baseline, I expect the curves to flatten out and then slowly decline. Note that Euromomo has always displayed sharp declines for the current curves, even back when Italy was just starting. It doesn't indicate deaths are falling significantly yet, I think it's just lag as new deaths have yet to be reported. Right now you're essentially comparing six weeks since the current epidemic started to take hold in Europe to 12 weeks for peak cold and flu seasons, and even then it's a tough comparison since we really don't know how much quarantining impacts all-cause mortality.

You have made the same mistake that everyone else has made.... assuming that the epidemic is "just starting." Funny, it was just supposed to be starting six weeks ago. In reality, the "virus" might have swept through the entire population back in the winter. The spike is just as likely a reporting delay as it is a sharp move up. The site even tells you as much. With adjustments, it's possible those deaths are even re-distributed to previous weeks.
 

Peater Piper

Member
Joined
Mar 18, 2016
Messages
817
You have made the same mistake that everyone else has made.... assuming that the epidemic is "just starting." Funny, it was just supposed to be starting six weeks ago. In reality, the "virus" might have swept through the entire population back in the winter.
I had my suspicions it might have been around in January, but no, I don't think it was anywhere in full-force until recently. I've seen no evidence of that. We have reliable all-cause mortality figures from several locations to support that there was no surge in deaths until at least March.

The spike is just as likely a reporting delay as it is a sharp move up. The site even tells you as much. With adjustments, it's possible those deaths are even re-distributed to previous weeks.
There's little to suggest that's going to happen, I've yet to see a curve significantly lowered in the last month. The greater odds are that more deaths will be added at different dates, not redistributed, but I admit I'm not entirely clear on how they're getting their data. But we can do a little research if you don't trust Euromomo. The UK, for example, has the ONS, which is only counting registered deaths. Weeks 14 and 15 had 16.3k and 18.5k registered deaths, respectively. Those numbers could grow since there's likely deaths that haven't been added yet. No other week this year is comparable. The closest was week 2 at just over 14k deaths, every other week has been under 13k deaths, and weeks 6-13 held steady at around 11k deaths. There's been a very clear surge in mortality. We can also look at previous weeks dating back to 2010. Weeks 14 and 15 of this year are the two highest weeks on record in the last decade.

Deaths registered weekly in England and Wales, provisional - Office for National Statistics
 

RealNeat

Member
Joined
Jan 9, 2019
Messages
2,371
Location
HI
That study is already going under heavy criticism .. I find it interesting the same critique isn't being applied to PCR, or presumptive deaths.
Seen this?


the strange part is that the guy says they've all been vaccinated?
 

maillol

Member
Joined
Oct 28, 2019
Messages
391
UK coronavirus deaths more than double official figure according to FT study | Free to read

Does this read as complete nonsense to everyone else too? I can't understand where they're getting this 41,000 number from.

I downloaded the actual weekly total death statistics from ONS. UK deaths usually average about 11,000 per month. The only weeks that are higher than that are the most recent two at 16,000 and 18,000. Maybe I'm missing something but I don't see how they can claim more than 12,000 deaths from corona.

Additionally the total deaths for the year so far are 160,000. The 5 year average for the same time period is 149,000. Not a big difference.
 

S.Seneff

Member
Joined
Mar 18, 2020
Messages
215
I read one time and I don't understand eitheir. And I never read a FT article more than once !

But their is a "beautifull" graph at the end of the article :
https%3A%2F%2Fd6c748xw2pzm8.cloudfront.net%2Fprod%2Fb82c6ec0-83f4-11ea-8d9b-3ddaa1e421ff-standard.png

And a litlle bit under : "The ONS data also showed that the vast majority of all excess deaths were people aged over 75 years old. This age bracket accounted for 70 per cent of the total, the same proportion as those with Covid-19 on their death certificates"
 
EMF Mitigation - Flush Niacin - Big 5 Minerals

Similar threads

Back
Top Bottom