Sugar Consumption Down 34% Since 1970

Joined
Nov 26, 2013
Messages
7,370
SugarAssoc_US_Sugar_Intake.jpg

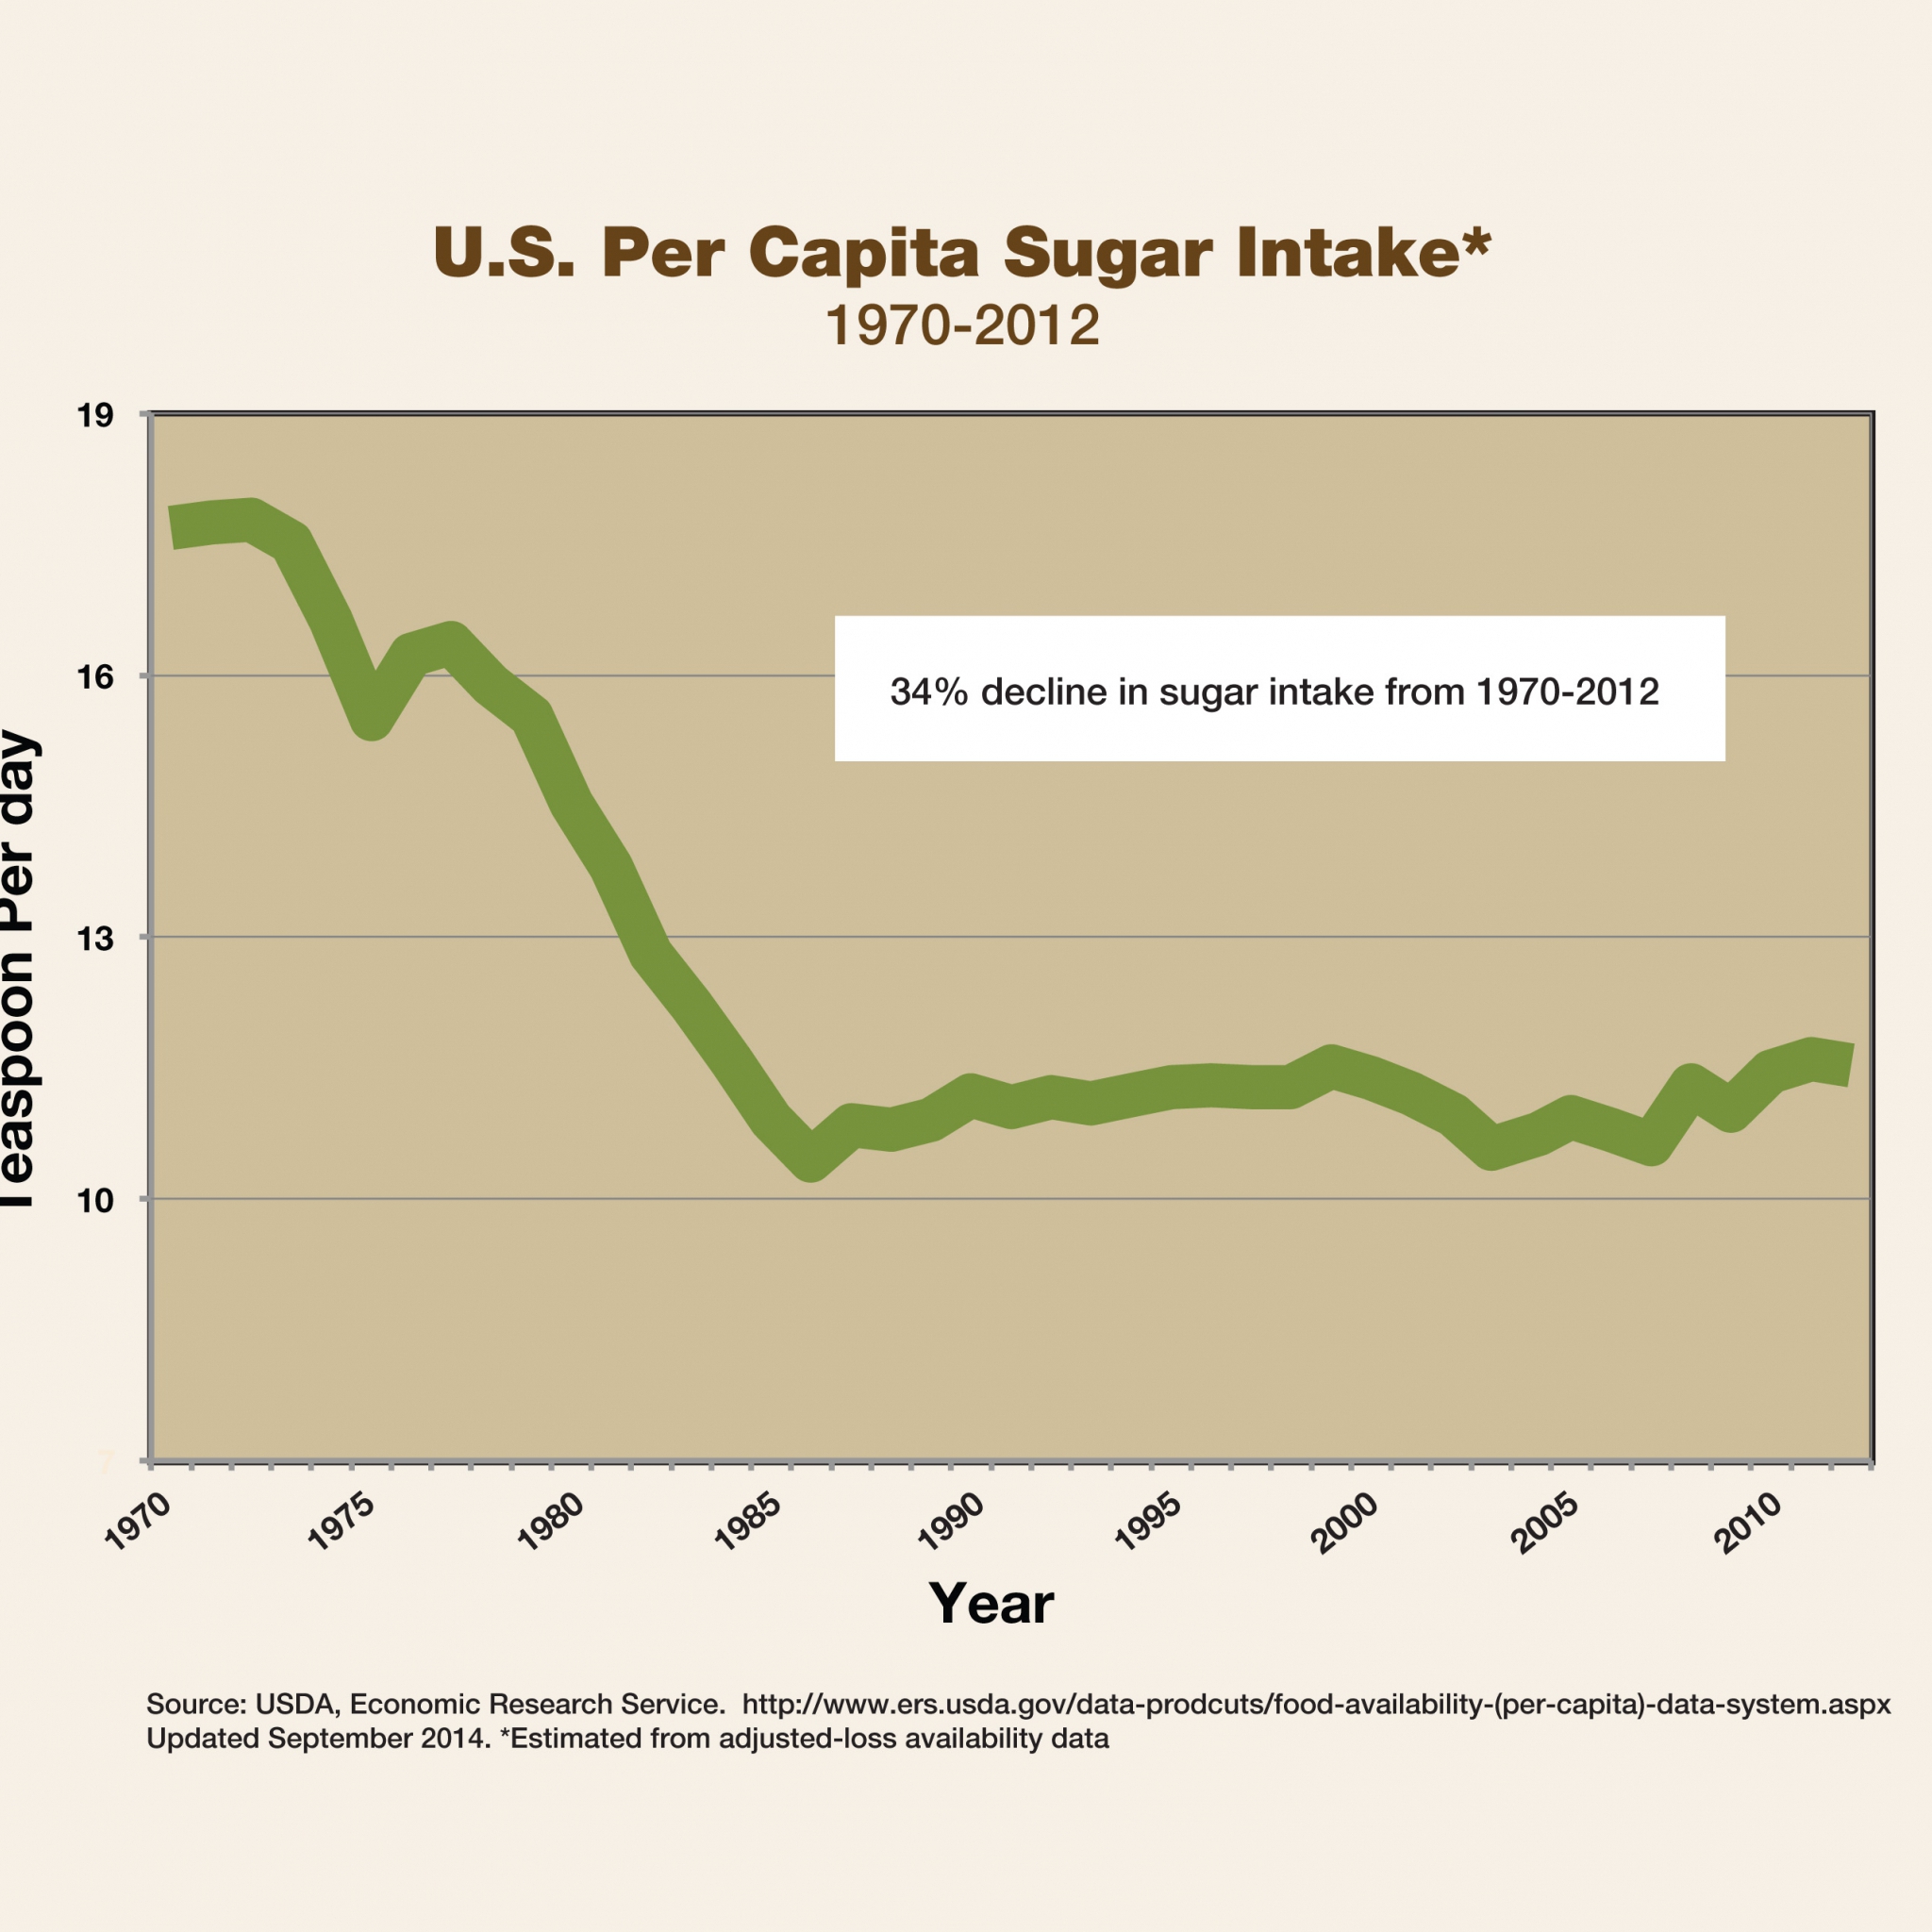
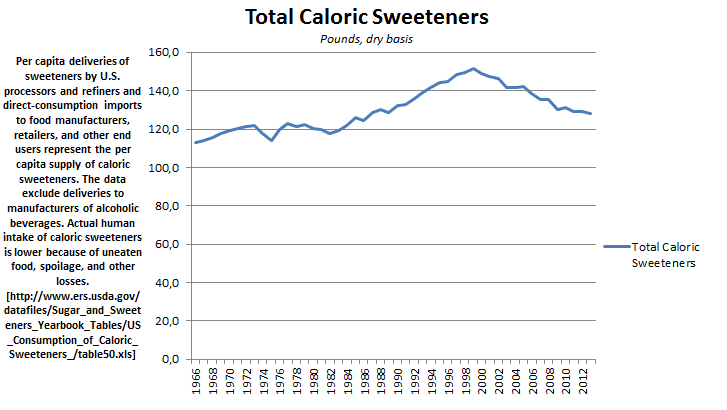
http://www.sugar.org/chart-is-sugar-consumption-trending-up-or-down/

Oh and by the way

XqISkdi.png

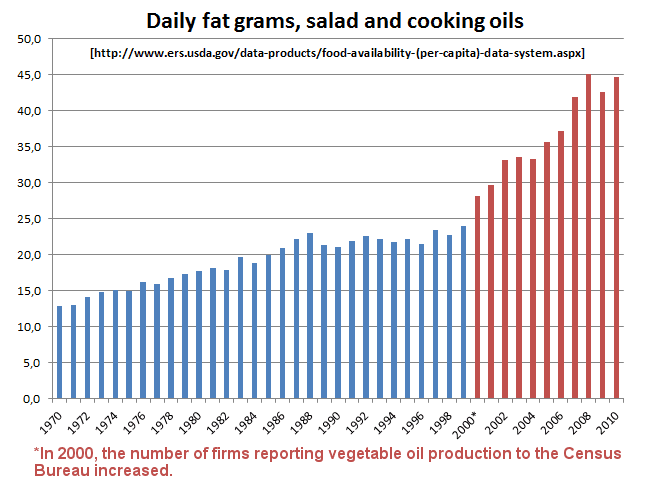
87.5% increase 1970-1999

HKpWkYS.png
 

YuraCZ

Member
Joined
Apr 24, 2015
Messages
674
Well it's clear enough that saturated fats and sugar isn't really problem. ******* PUFAs...
 

jyb

Member
Joined
Nov 9, 2012
Messages
2,783
Location
UK
Explosion of pufa oils since 2000? Seems like the party is just getting started then ;)

That said, the study about sugar is dishonest. To get an idea of "pure carb" intake (as opposed to nutritious carbs), they should have looked at various syrups rather than just sucrose, as we could expect pure corn syrup or other refined products to have similar problems (or benefits) to sucrose.
 

Tom

Member
Joined
Dec 30, 2013
Messages
100
Interesting rise in canola oil. Do you have the figures for soybean oil? I think this accounts still for 2/3 of the vegetable oil intake in the US. But overall it should give a very good omega-3 to omega-6 ratio, if this is beneficial.
 
OP
S
Joined
Nov 26, 2013
Messages
7,370
jyb said:
Explosion of pufa oils since 2000? Seems like the party is just getting started then ;)

That said, the study about sugar is dishonest. To get an idea of "pure carb" intake (as opposed to nutritious carbs), they should have looked at various syrups rather than just sucrose, as we could expect pure corn syrup or other refined products to have similar problems (or benefits) to sucrose.

Uh yeah, we are talking about the supermarket definition of sugar here :mrgreen:

This is for almost every sweetener that has real calories in it:

1IHAzXX.png


As you can see, the witch hunt is pretty dumb even for nasty syrups. The same website wrote about it here http://www.sugar.org/americans-are-cons ... weeteners/ . They only show from the peak onwards, so clearly they are a lobby :cool: but some poor intern probably had to make these and they have no hope of salvaging the industry anyway...
 
OP
S
Joined
Nov 26, 2013
Messages
7,370
Tom said:
Interesting rise in canola oil. Do you have the figures for soybean oil? I think this accounts still for 2/3 of the vegetable oil intake in the US. But overall it should give a very good omega-3 to omega-6 ratio, if this is beneficial.

No there aren't, I agree it should still be a big player in food manufacturing but there seems to be a price increase.

http://www.ers.usda.gov/topics/crops/soybeans-oil-crops/market-outlook/usda-soybean-baseline said:
In the projections, soybean production declines initially (2010/11-2011/12) and then increases incrementally with a modest improvement in yields and planted acreage. The expected growth in U.S. soybean supply should allow for a moderate rise in domestic use and exports. However, exporters from South America are expected to garner most of the expansion in global trade for soybeans and soybean products, much of which will center on meeting a rapidly rising demand in China.

baseline5fw.png

Vak1Td6.png

OGVhism.png


They reflect the price increase but maybe it's simply more companies reporting to the Bureau.
 

tara

Member
Joined
Mar 29, 2014
Messages
10,368
Am I reading this right? 60 lbs soybean oil per capita per year? Ie ~70g per person per day?
Wow. And for all the people who eat much less than this, there must be many who eat more. And that's just the soybean oil, not counting the canola, corn oil, etc.
 
OP
S
Joined
Nov 26, 2013
Messages
7,370
tara said:
Am I reading this right? 60 lbs soybean oil per capita per year? Ie ~70g per person per day?
Wow. And for all the people who eat much less than this, there must be many who eat more. And that's just the soybean oil, not counting the canola, corn oil, etc.

I think that indicates the amount that "disappears" at the end of the year after you subtract exports, etc.
 

tara

Member
Joined
Mar 29, 2014
Messages
10,368
Such_Saturation said:
tara said:
Am I reading this right? 60 lbs soybean oil per capita per year? Ie ~70g per person per day?
Wow. And for all the people who eat much less than this, there must be many who eat more. And that's just the soybean oil, not counting the canola, corn oil, etc.

I think that indicates the amount that "disappears" at the end of the year after you subtract exports, etc.
Ok, that makes sense. So maybe more than half of it gets discarded as waste etc, and not so much gets eaten.
 
OP
S
Joined
Nov 26, 2013
Messages
7,370
I'm pretty sure they invented that term, all the tables are pretty odd anyway... some data is "withheld to prevent disclosure" :confused
 

schultz

Member
Joined
Jul 29, 2014
Messages
2,653
I love graphs!!! :shock:
 

Attachments

  • Fats.jpg
    Fats.jpg
    18.7 KB · Views: 792
  • fats2.jpg
    fats2.jpg
    20.6 KB · Views: 793
  • iron.jpg
    iron.jpg
    13.2 KB · Views: 792

XPlus

Member
Joined
Dec 16, 2014
Messages
556
Very interesting.
Was looking at of photos of my family, including extended family and friends, from 60s, 70s and 80s. Wedding photos, town crowds.
Comparing these photos to how most people of similar age look now, those trends say a lot.

You bet it's not just correlation.
 

Tom

Member
Joined
Dec 30, 2013
Messages
100
Very interesting charts. But also confusing.

There is some good information on statista.com suggesting that soybean oil is still the most widely used edible oil in the US, accounting for over 60% (4 x higher than canola oil).
http://www.statista.com/statistics/3010 ... s-by-type/

On a side note, observe the much higher life expectancy in Israel than in US despite a higher linolic acid intake and poorer n6 to n3 ratio:

Israeli Jews eat a diet which is richer in linoleic acid (the most readily available plant-based form of omega-6 fatty acid, found in many vegetable oils), than any other population on the planet. Average per capita consumption is approximately 30 grams a day (11 kilograms annually),[1] compared to 25 grams daily for the average American in 1985.[2]

http://en.wikipedia.org/wiki/Israeli_paradox
 

jyb

Member
Joined
Nov 9, 2012
Messages
2,783
Location
UK
XPlus said:
Very interesting.
Was looking at of photos of my family, including extended family and friends, from 60s, 70s and 80s. Wedding photos, town crowds.
Comparing these photos to how most people of similar age look now, those trends say a lot.

You bet it's not just correlation.

You only need to watch an old movie. Preferably a documentary, so the movie doesn't introduce a bias into who is in society is filmed. Then you can only be astonished by how good an average Joe looked back in the days compared to now.
 

jyb

Member
Joined
Nov 9, 2012
Messages
2,783
Location
UK
Tom said:
Very interesting charts. But also confusing.

There is some good information on statista.com suggesting that soybean oil is still the most widely used edible oil in the US, accounting for over 60% (4 x higher than canola oil).
http://www.statista.com/statistics/3010 ... s-by-type/

On a side note, observe the much higher life expectancy in Israel than in US despite a higher linolic acid intake and poorer n6 to n3 ratio:

Israeli Jews eat a diet which is richer in linoleic acid (the most readily available plant-based form of omega-6 fatty acid, found in many vegetable oils), than any other population on the planet. Average per capita consumption is approximately 30 grams a day (11 kilograms annually),[1] compared to 25 grams daily for the average American in 1985.[2]

http://en.wikipedia.org/wiki/Israeli_paradox

So much paradox. Isaerli paradox, French paradox... If the whole world is a paradox, then its not a paradox anymore :lol:
 

XPlus

Member
Joined
Dec 16, 2014
Messages
556
jyb said:
XPlus said:
Very interesting.
Was looking at of photos of my family, including extended family and friends, from 60s, 70s and 80s. Wedding photos, town crowds.
Comparing these photos to how most people of similar age look now, those trends say a lot.

You bet it's not just correlation.

You only need to watch an old movie. Preferably a documentary, so the movie doesn't introduce a bias into who is in society is filmed. Then you can only be astonished by how good an average Joe looked back in the days compared to now.

Now we know what the decline of modern civilization looks like.
 
OP
S
Joined
Nov 26, 2013
Messages
7,370
Tom said:
Very interesting charts. But also confusing.

There is some good information on statista.com suggesting that soybean oil is still the most widely used edible oil in the US, accounting for over 60% (4 x higher than canola oil).
http://www.statista.com/statistics/3010 ... s-by-type/

Sorry, I don't have the premium account, what is the source? Is there conflict with the posted information?

Tom said:
On a side note, observe the much higher life expectancy in Israel than in US despite a higher linolic acid intake and poorer n6 to n3 ratio:

Israeli Jews eat a diet which is richer in linoleic acid (the most readily available plant-based form of omega-6 fatty acid, found in many vegetable oils), than any other population on the planet. Average per capita consumption is approximately 30 grams a day (11 kilograms annually),[1] compared to 25 grams daily for the average American in 1985.[2]

Check out:

http://www.ncbi.nlm.nih.gov/pmc/articles/PMC3735464/ said:
To address the potential for spurious associations to arise because of the measurement of fatty acids as proportion of total weight rather than absolute concentration (33) and to address the question of the importance of the ω-3/ω-6 ratio, long-chain ω-3 and ω-6 PUFA were included together in regression models predicting total, low-, and high-grade prostate cancer risk. Findings for total long-chain ω-3 PUFA adjusted for ω-6 PUFA were only slightly attenuated. The continuous multivariable-adjusted hazard ratios predicting total, low-, and high-grade prostate cancer risk, respectively, were 1.16 (95% CI = 0.98 to 1.36), 1.15 (95% CI = 0.97 to 1.36), and 1.40 (95% CI = 1.03 to 1.92)

http://www.ncbi.nlm.nih.gov/pmc/articles/PMC3735464/ said:
Among the seven prospective studies of ω-6 PUFA (14,31,35–39,41), two reported inverse associations for LA (35,38), and, similar to our study, all others reported no associations.
 

Tom

Member
Joined
Dec 30, 2013
Messages
100
You might be able to see the charts in full if you get to the website via a google search
 

Attachments

  • oils.png
    oils.png
    9.9 KB · Views: 565
OP
S
Joined
Nov 26, 2013
Messages
7,370
Tom said:
You might be able to see the charts in full if you get to the website via a google search

Yes that is quite in line with the first charts, but no files on the USDA website seem to list soybean oil when it comes to oil comparisons.
 

jyb

Member
Joined
Nov 9, 2012
Messages
2,783
Location
UK
Tom said:
You might be able to see the charts in full if you get to the website via a google search

I am very surprised to see coconut oil as high as this. And also higher than sunflower and olive. I had really never heard of it before caring about diet nor saw anyone using it.
 
EMF Mitigation - Flush Niacin - Big 5 Minerals

Similar threads

Back
Top Bottom