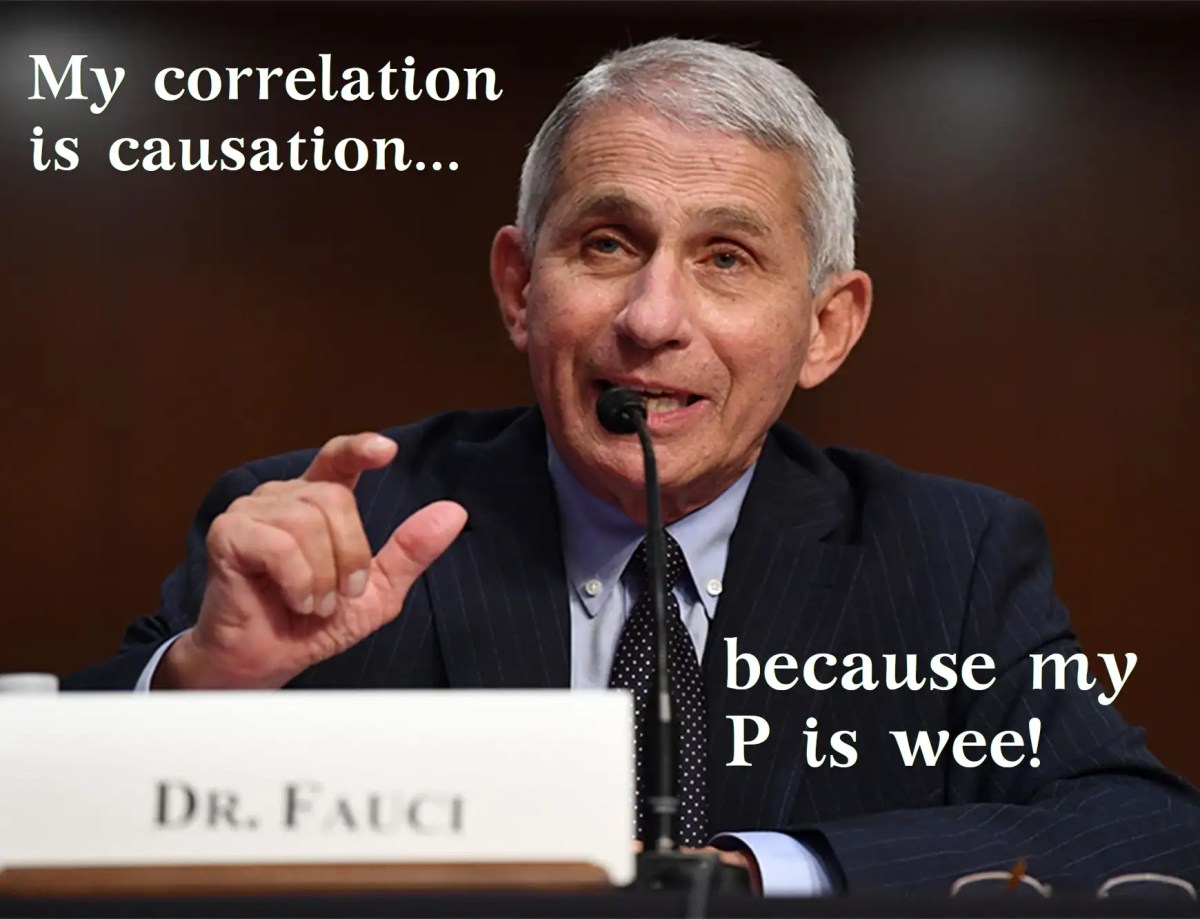
When somebody emailed Peat with the latest study showing a highly statistically significant outcome that immunosuppression was a viable treatment of autoimmune conditions, Peat's response was that most studies with "statistically significant" results are actually quite insignificant and often based on heavily manipulated data. He also said that often the studies that do not show statistical significance are the ones to pay attention to. It looks like quite a few scientists in the medical field agree and, according to the article below, there is now a petition to NSF to abandon the term statistical significance the other binary categorizations schemes. And as the article aptly notes, often it is people without any statistical background that are capable of drawing viable conclusions based on the data while statisticians are paralyzed by their own biased analysis.
Scientists rise up against statistical significance
"...When was the last time you heard a seminar speaker claim there was ‘no difference’ between two groups because the difference was ‘statistically non-significant’? If your experience matches ours, there’s a good chance that this happened at the last talk you attended. We hope that at least someone in the audience was perplexed if, as frequently happens, a plot or table showed that there actually was a difference. How do statistics so often lead scientists to deny differences that those not educated in statistics can plainly see? For several generations, researchers have been warned that a statistically non-significant result does not ‘prove’ the null hypothesis (the hypothesis that there is no difference between groups or no effect of a treatment on some measured outcome)1. Nor do statistically significant results ‘prove’ some other hypothesis. Such misconceptions have famously warped the literature with overstated claims and, less famously, led to claims of conflicts between studies where none exists."
"...Let’s be clear about what must stop: we should never conclude there is ‘no difference’ or ‘no association’ just because a P value is larger than a threshold such as 0.05 or, equivalently, because a confidence interval includes zero. Neither should we conclude that two studies conflict because one had a statistically significant result and the other did not. These errors waste research efforts and misinform policy decisions."
"...These and similar errors are widespread. Surveys of hundreds of articles have found that statistically non-significant results are interpreted as indicating ‘no difference’ or ‘no effect’ in around half (see ‘Wrong interpretations’ and Supplementary Information). In 2016, the American Statistical Association released a statement in The American Statistician warning against the misuse of statistical significance and P values. The issue also included many commentaries on the subject. This month, a special issue in the same journal attempts to push these reforms further. It presents more than 40 papers on ‘Statistical inference in the 21st century: a world beyond P < 0.05’. The editors introduce the collection with the caution “don’t say ‘statistically significant’”3. Another article4 with dozens of signatories also calls on authors and journal editors to disavow those terms. We agree, and call for the entire concept of statistical significance to be abandoned."
"...We must learn to embrace uncertainty. One practical way to do so is to rename confidence intervals as ‘compatibility intervals’ and interpret them in a way that avoids overconfidence. Specifically, we recommend that authors describe the practical implications of all values inside the interval, especially the observed effect (or point estimate) and the limits. In doing so, they should remember that all the values between the interval’s limits are reasonably compatible with the data, given the statistical assumptions used to compute the interval7,10. Therefore, singling out one particular value (such as the null value) in the interval as ‘shown’ makes no sense. We’re frankly sick of seeing such nonsensical ‘proofs of the null’ and claims of non-association in presentations, research articles, reviews and instructional materials. An interval that contains the null value will often also contain non-null values of high practical importance. That said, if you deem all of the values inside the interval to be practically unimportant, you might then be able to say something like ‘our results are most compatible with no important effect’."
"...Last, and most important of all, be humble: compatibility assessments hinge on the correctness of the statistical assumptions used to compute the interval. In practice, these assumptions are at best subject to considerable uncertainty7,8,10. Make these assumptions as clear as possible and test the ones you can, for example by plotting your data and by fitting alternative models, and then reporting all results."
"...What will retiring statistical significance look like? We hope that methods sections and data tabulation will be more detailed and nuanced. Authors will emphasize their estimates and the uncertainty in them — for example, by explicitly discussing the lower and upper limits of their intervals. They will not rely on significance tests. When P values are reported, they will be given with sensible precision (for example, P = 0.021 or P = 0.13) — without adornments such as stars or letters to denote statistical significance and not as binary inequalities (P < 0.05 or P > 0.05). Decisions to interpret or to publish results will not be based on statistical thresholds. People will spend less time with statistical software, and more time thinking."